2.3 Unipart network for location analysis
This section deals with unipart network that represent relationship of germplasm diffusion between locations. The representation can be done for each germplasm or for each year.
2.3.1 Steps with PPBstats
- Format the data with
format_data_PPBstats() - get descriptive plot with
plot()
2.3.2 Format the data
The format required is a data frame with the following compulsory columns as factor:
"location_parent": the location associated to the parent seed lot"location_child": the location associated to the child seed lot"relation_year_start": the year when the relationship starts"relation_year_end": the year when the relationship stops
Possible column options are :
"germplasm_parent": the germplasm associated to the parent seed lot"year_parent": the year of the last relationship of the parent seed lot"germplasm_child": the germplasm associated to the child seed lot"year_child": represents the year of the last relation event of the child seed lot
Other possibles column option are : "long_parent", "lat_parent", "long_child", "lat_child" to get map representation.
Note that data frame with unipart network for seed lots format can also be used.
The format of the data are checked by the function format_data_PPBstats() with the following arguments :
type:"data_network"network_part:"unipart"vertex_type:"location"network_split:"germplasm"or"relation_year_start".
The function returns list of igraph object2 coming from igraph::graph_from_data_frame().
data(data_network_unipart_sl)
head(data_network_unipart_sl)
## seed_lot_parent seed_lot_child relation_type
## 1 germ-8_loc-1_2007_0001 germ-8_loc-1_2008_0001 selection
## 2 germ-8_loc-1_2008_0001 germ-8_loc-1_2009_0001 reproduction
## 3 germ-8_loc-1_2009_0001 germ-8_loc-2_2009_0001 diffusion
## 4 germ-8_loc-1_2008_0001 germ-8_loc-1_2009_0001 selection
## 5 germ-1_loc-1_2005_0001 germ-8_loc-1_2006_0001 reproduction
## 6 germ-6_loc-1_2005_0001 germ-8_loc-1_2006_0001 reproduction
## relation_year_start relation_year_end germplasm_parent location_parent
## 1 2007 2008 germ-8 loc-1
## 2 2008 2009 germ-8 loc-1
## 3 2009 2009 germ-8 loc-1
## 4 2008 2009 germ-8 loc-1
## 5 2005 2006 germ-1 loc-1
## 6 2005 2006 germ-6 loc-1
## year_parent alt_parent long_parent lat_parent germplasm_child
## 1 2007 50 0.616363 44.20314 germ-8
## 2 2008 50 0.616363 44.20314 germ-8
## 3 2009 50 0.616363 44.20314 germ-8
## 4 2008 50 0.616363 44.20314 germ-8
## 5 2005 50 0.616363 44.20314 germ-8
## 6 2005 50 0.616363 44.20314 germ-8
## location_child year_child alt_child long_child lat_child
## 1 loc-1 2008 50 0.616363 44.20314
## 2 loc-1 2009 50 0.616363 44.20314
## 3 loc-2 2009 360 3.087025 45.77722
## 4 loc-1 2009 50 0.616363 44.20314
## 5 loc-1 2006 50 0.616363 44.20314
## 6 loc-1 2006 50 0.616363 44.203142.3.3 Format and describe the data for each germplasm
For network_split = "germplasm", it returns a list with as many elements as germplam in the data
as well as all germplasms merged in the first element of the list.
net_unipart_location_g = format_data_PPBstats(
  type = "data_network",
  data = data_network_unipart_sl,
  network_part = "unipart",
  vertex_type =  "location",
  network_split = "germplasm")
## data has been formated for PPBstats functions.names(net_unipart_location_g)## [1] "germ-10 / germ-11 / germ-12 / germ-13 / germ-2 / germ-3 / germ-4 / germ-5 / germ-8 / germ-9"
## [2] "germ-10"
## [3] "germ-11"
## [4] "germ-12"
## [5] "germ-13"
## [6] "germ-2"
## [7] "germ-3"
## [8] "germ-4"
## [9] "germ-5"
## [10] "germ-8"
## [11] "germ-9"The different representations are done with the plot() function.
For network representation, set plot_type = "network" diffusion event are display with curve.
in_col can be settle to customize color of vertex.
The curve between location represent the diffusion, the number of diffusion is displayed on a color scale.
p_net = plot(net_unipart_location_g, plot_type = "network",
                          labels_on = "location", labels_size = 4)
names(p_net) # one element per germplasm, the first element with all the data
## [1] "germ-10 / germ-11 / germ-12 / germ-13 / germ-2 / germ-3 / germ-4 / germ-5 / germ-8 / germ-9"
## [2] "germ-10"
## [3] "germ-11"
## [4] "germ-12"
## [5] "germ-13"
## [6] "germ-8"
## [7] "germ-9"p_net$`germ-2`## NULL2.3.4 Format and describe the data for each year
For network_split = "relation_year_start", it returns a list with as many elements as year in the data
as well as all years merged in the first element of the list.
net_unipart_location_y = format_data_PPBstats(
  type = "data_network",
  data = data_network_unipart_sl,
  network_part = "unipart",
  vertex_type =  "location",
  network_split = "relation_year_start")
## data has been formated for PPBstats functions.names(net_unipart_location_y)## [1] "2007-2008-2009" "2007" "2008" "2009"The different representations are done with the plot() function.
For network representation, set plot_type = "network" diffusion event are display with curve.
in_col can be settle to customize color of vertex.
The curve between location represent the diffusion, the number of diffusion is displayed on a color scale.
p_net = plot(net_unipart_location_y, plot_type = "network",
                          labels_on = "location", labels_size = 4)
names(p_net) # one element per year, the first element with all the data
## [1] "2007-2008-2009" "2007" "2008" "2009"p_net$`2007-2008-2009`## $network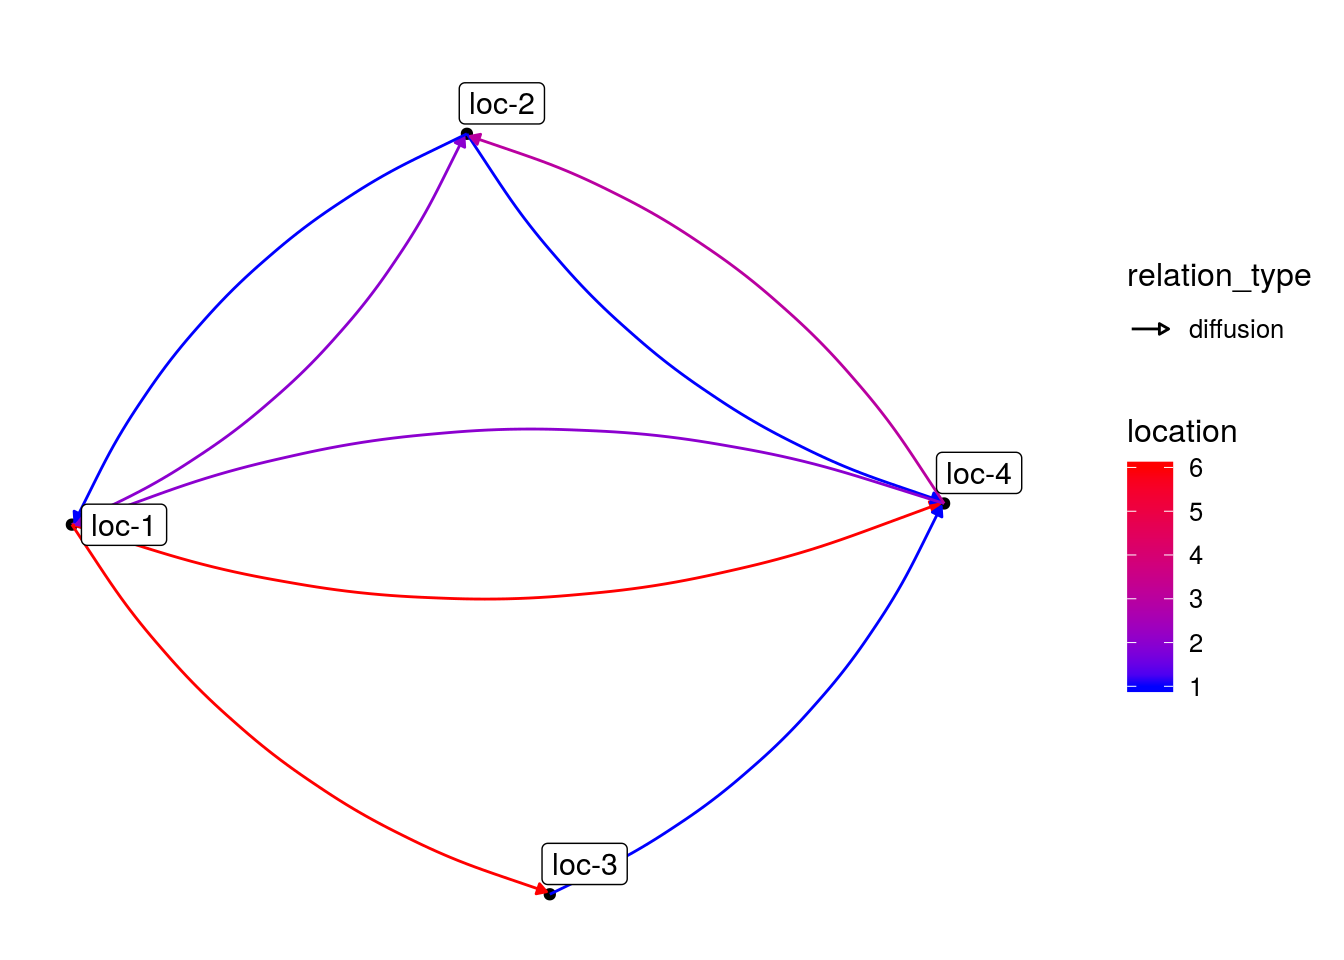
With barplots, it represents the number of germplasm received or given.
p_bar = plot(net_unipart_location_y, plot_type = "barplot", x_axis = "location", in_col = "germplasm")
names(p_bar) # one element per year, the first element with all the data
## [1] "2007-2008-2009" "2007" "2008" "2009"p_bar = p_bar$`2007-2008-2009`
p_bar$barplot$received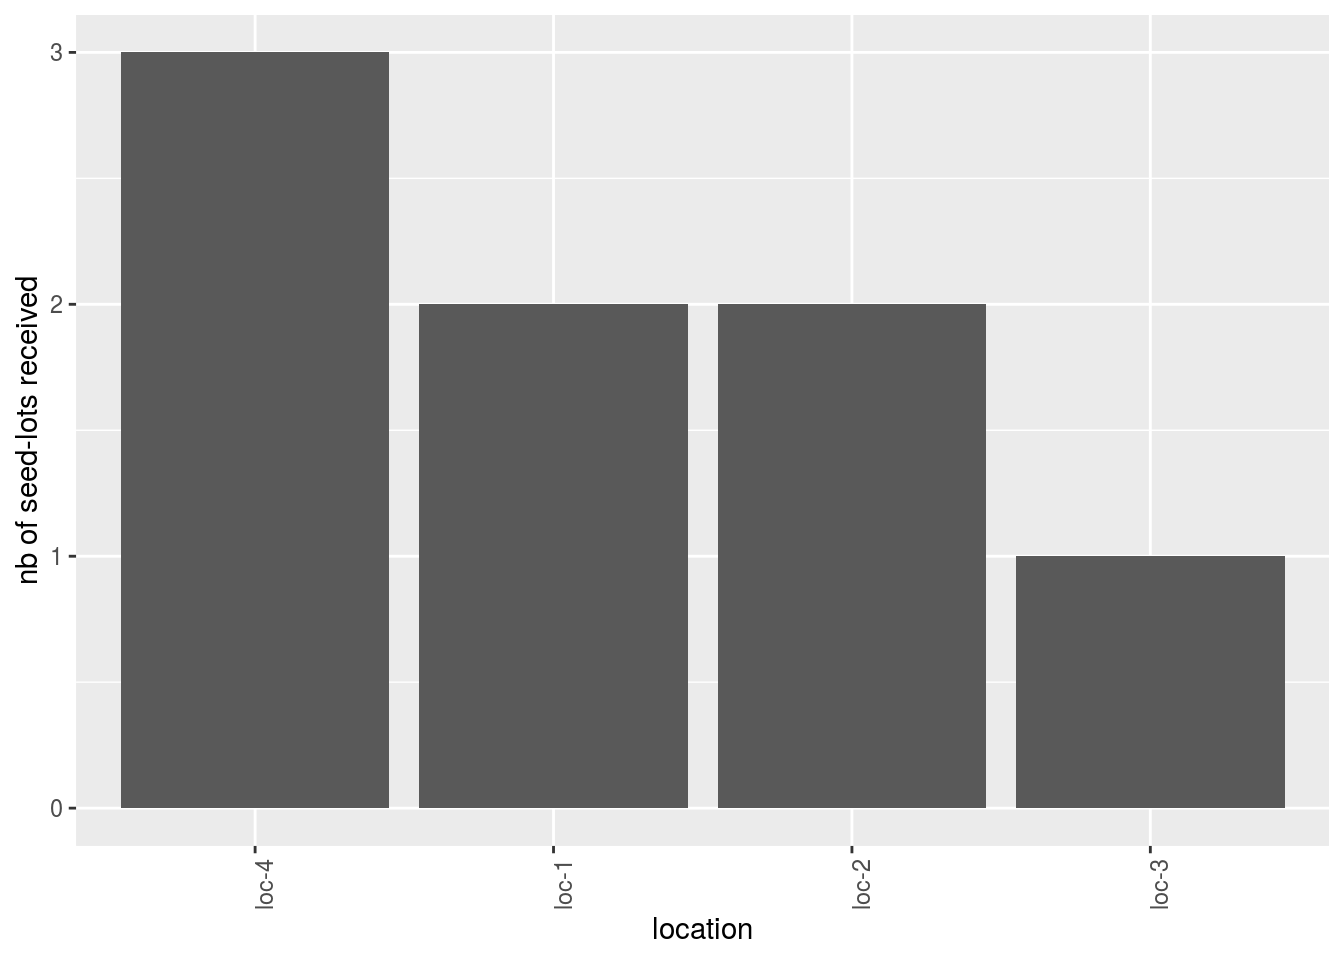
p_bar$barplot$given
Location present on the network can be displayed on a map with plot_type = "map".
When using map, do not forget to use credit :
Map tiles by Stamen Design,
under CC BY 3.0.
Data by OpenStreetMap,
under ODbL.
p_map = PPBstats:::plot.data_network(net_unipart_location_y[1], plot_type = "map", labels_on = "location")
# Note if you want to do it on all element of the list, you should use
# plot(net_unipart_location_y, plot_type = "map", labels_on = "location")
# Here we use PPBstats:::plot.data_network only not to ask to often the map server that may bug if there are too many query
# We use ::: because the function is not exported as it is an S3 method
p_map$`2007-2008-2009`
## $map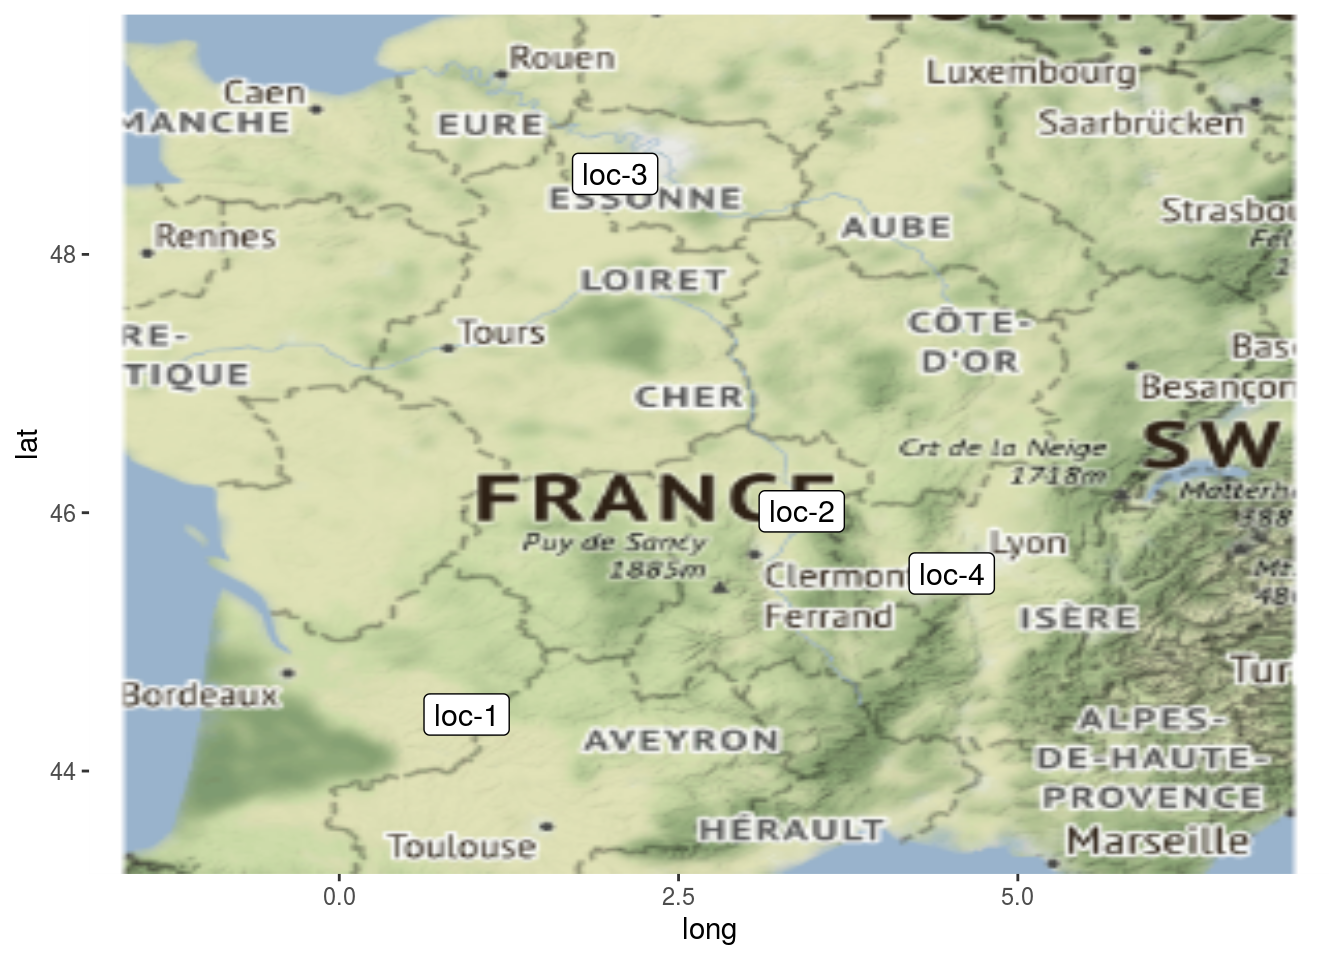
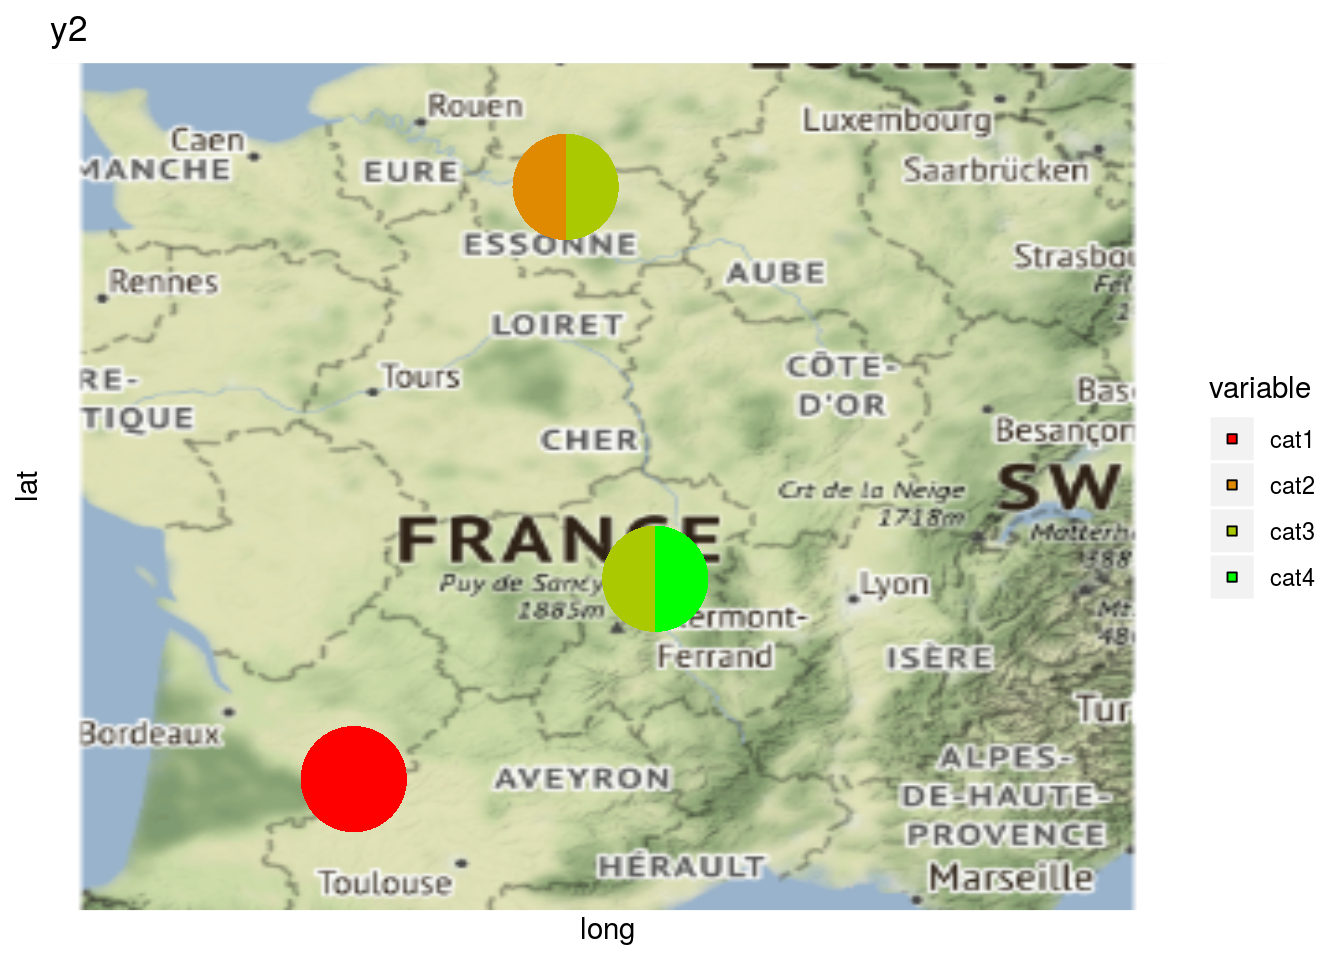
As well as plot information regarding a variable on map with a pie with plot_type = "map" and by setting arguments data_to_pie and vec_variables:
# y1 is a quantitative variable
p_map_pies_y1 = PPBstats:::plot.data_network(net_unipart_location_y[1], data_to_pie, plot_type = "map", vec_variables = "y1")
p_map_pies_y1$`2007-2008-2009`
## $y1_map_with_pies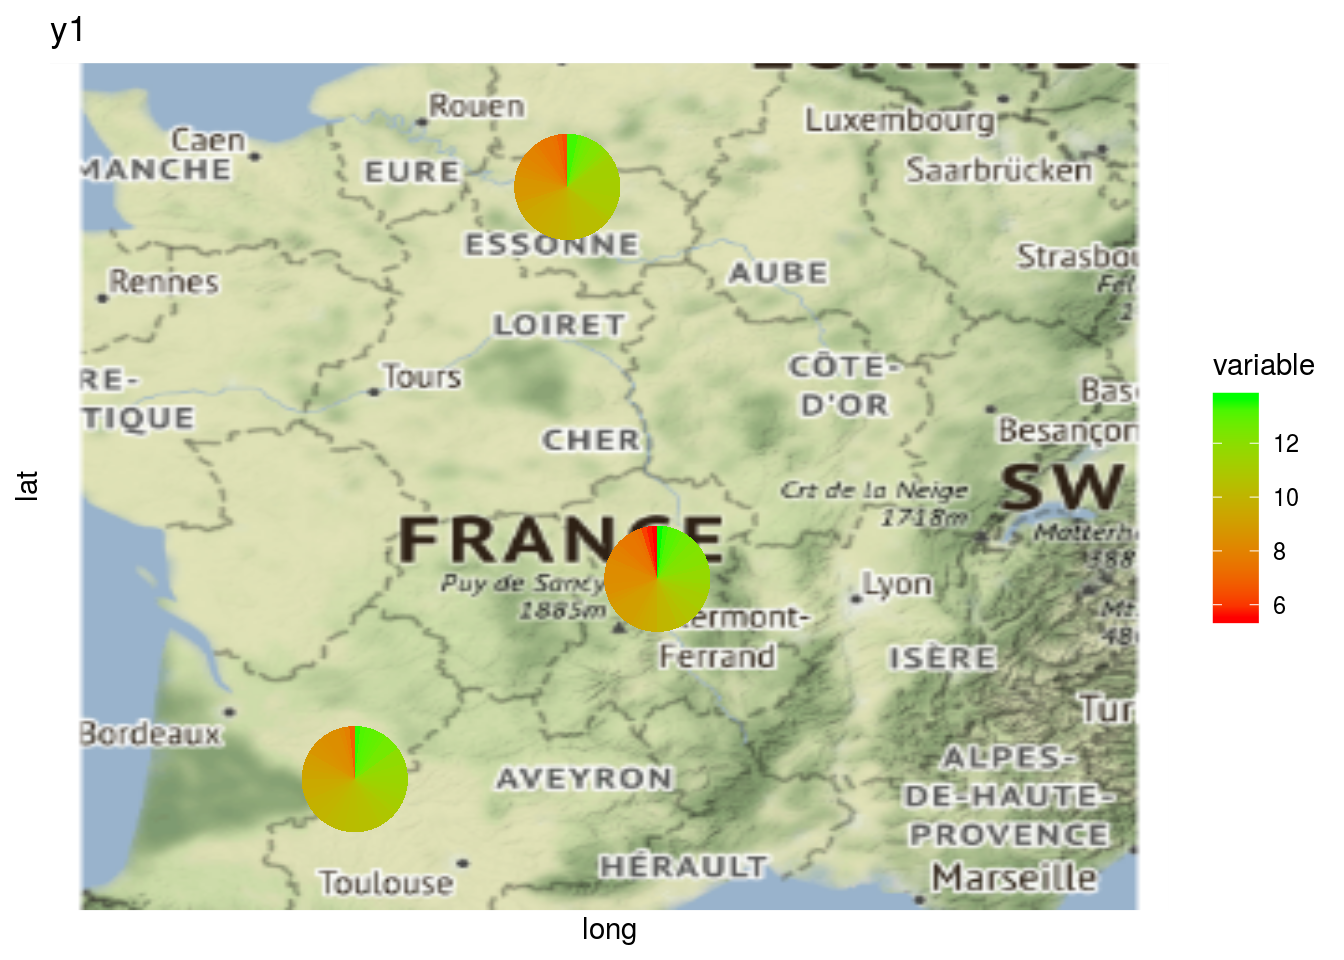
# y2 is a qualitative variable
p_map_pies_y2 = PPBstats:::plot.data_network(net_unipart_location_y[1], data_to_pie, plot_type = "map", vec_variables = "y2")
p_map_pies_y2$`2007-2008-2009`
## $y2_map_with_pies