4.1 Introduction
First, chose your objective (4.1.1), then the analyses and the experimental design based on a decision tree.
Finally see how to implement it based on the workflow and function relations (4.1.3) from formated data (4.1.4).
4.1.1 Analysis according to the objectives
In order to compare different germplasms on each location for selection, three main objectives dealing with PPB programmes organoleptic analyses can be :
Understand and check consumers preferences. This can be done through hedonic analysis (section 4.3).
Characterize products sensory properties. This can be done through napping analysis (section 4.4).
Rank product according to few sensory descriptors. This can be done through rank analysis (section 4.5).
4.1.2 Decision tree
For each analysis, a decision tree is proposed (Figure 4.1) based on the objective, the number of products and the number of tasters. For all analysis, no training is needed for tasters.
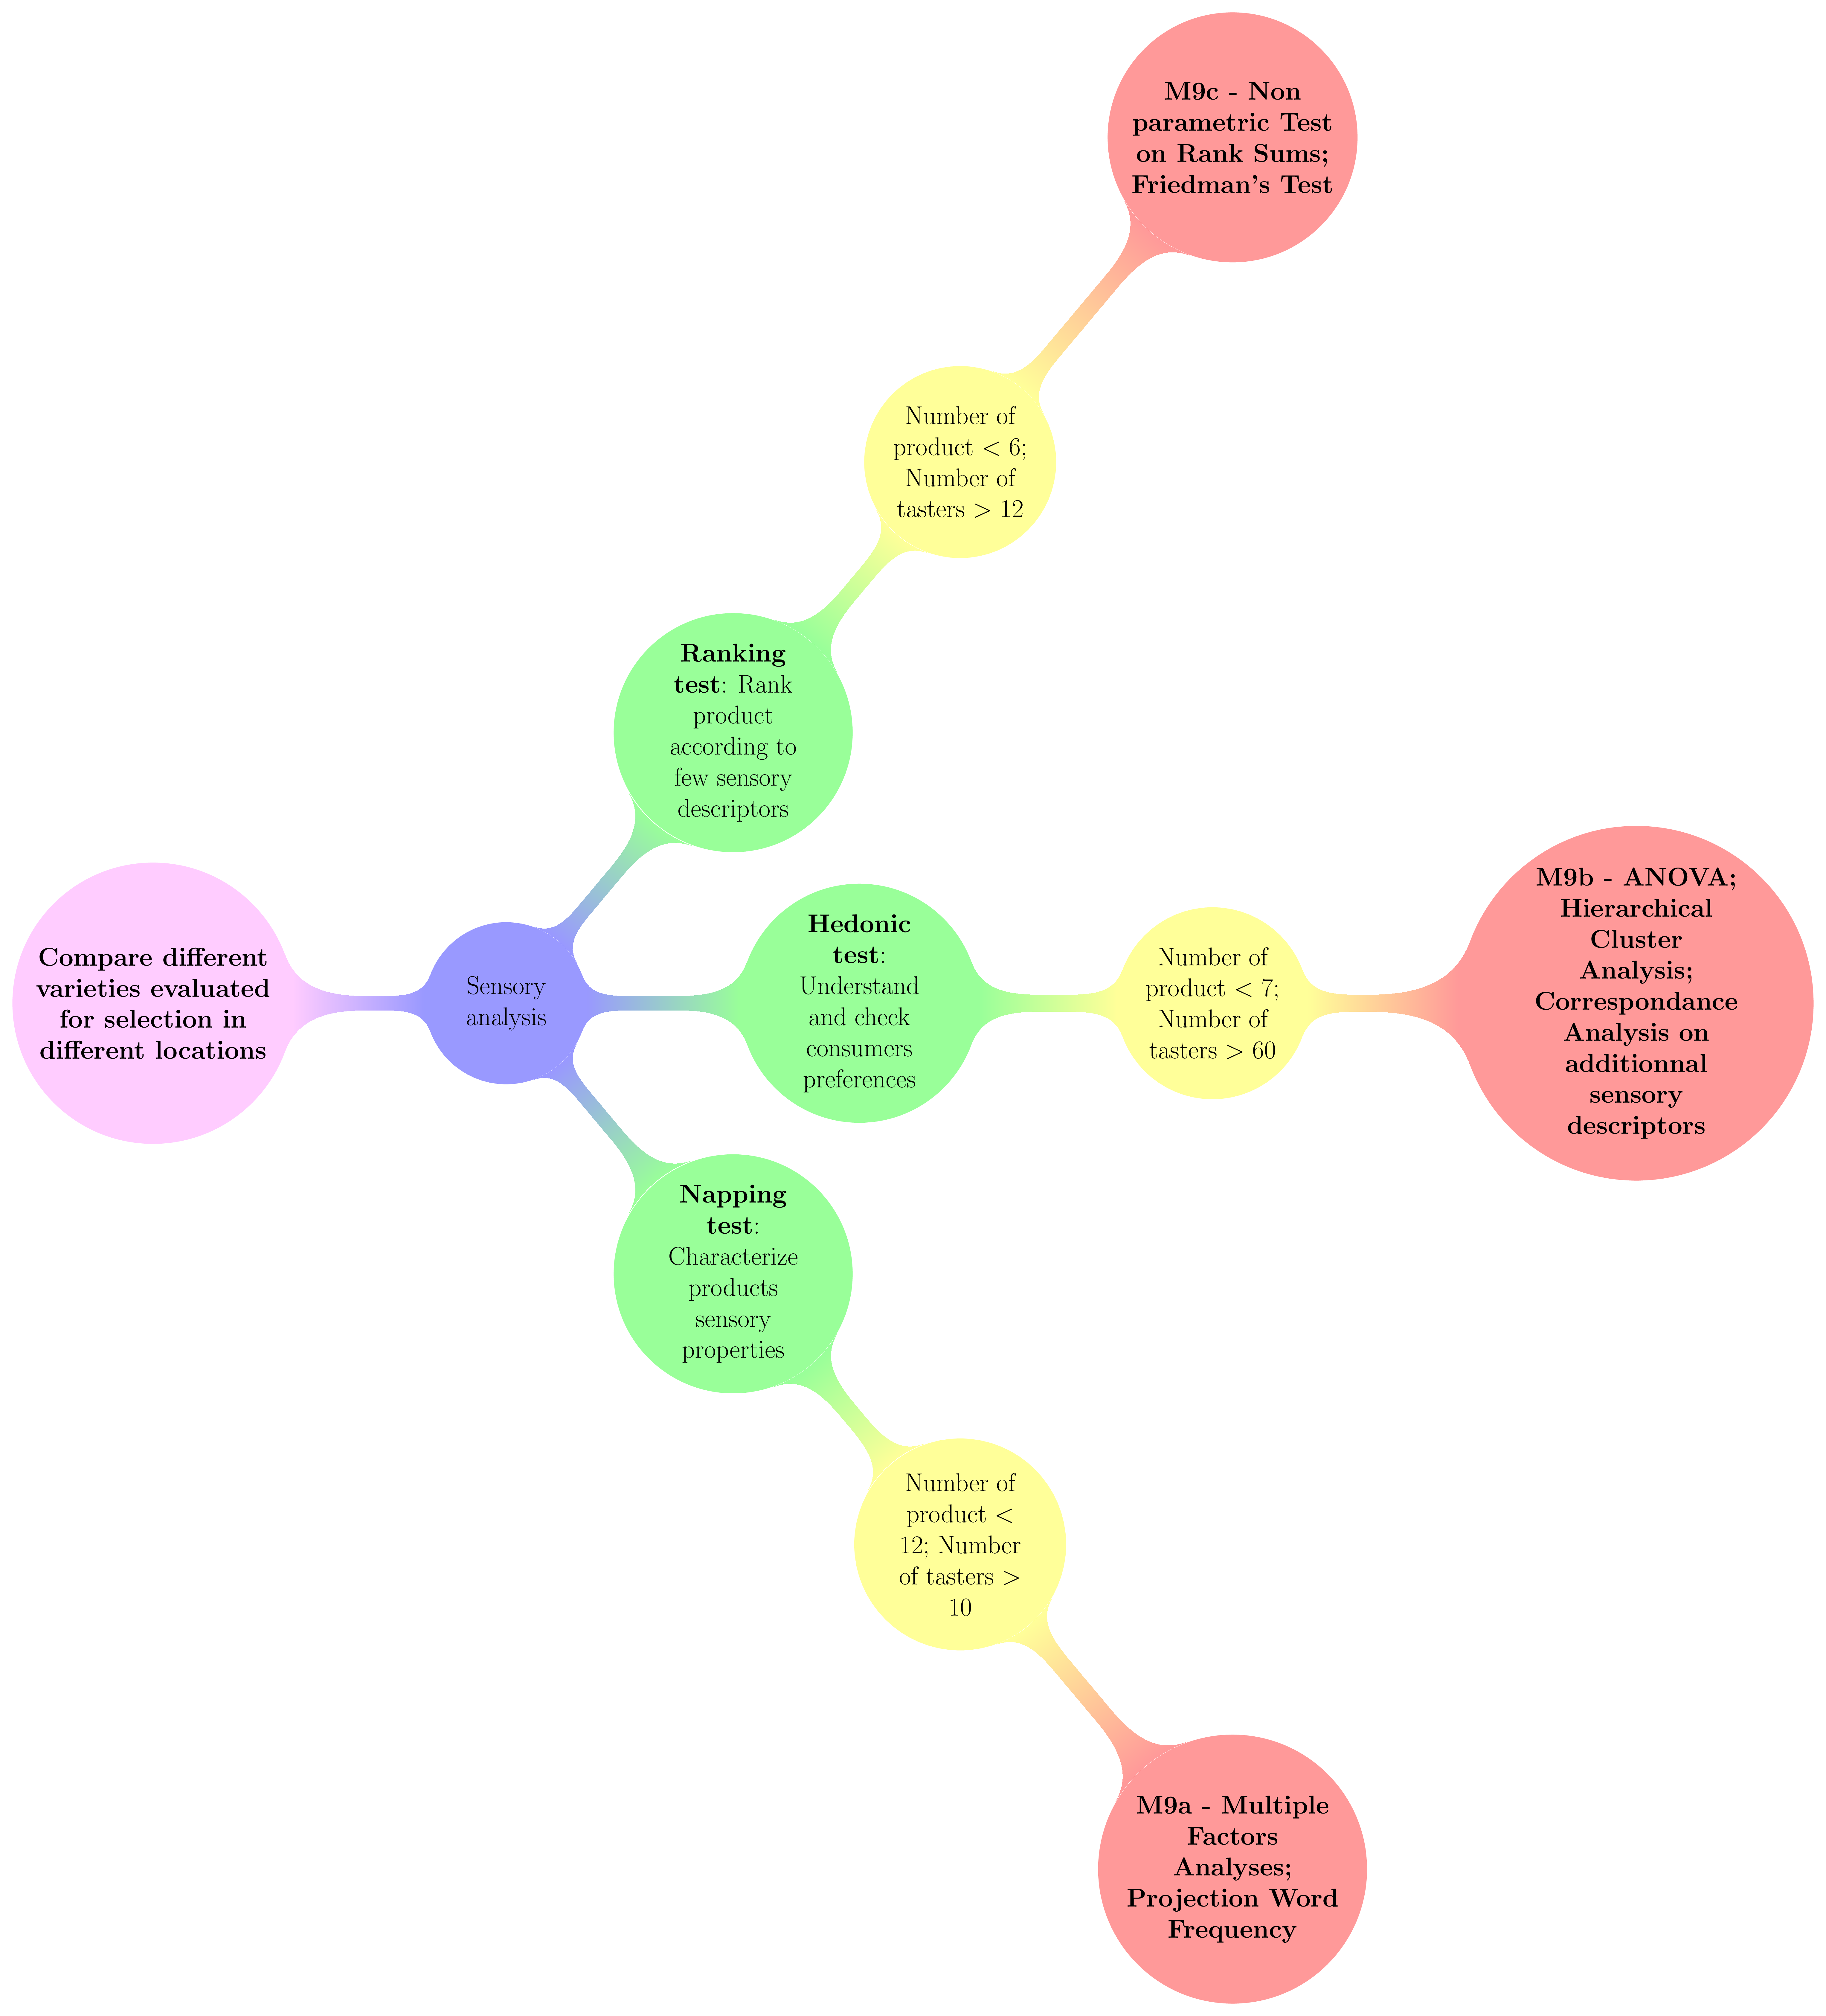
Figure 4.1: Decision tree with experimental constraints, designs and methods of sensory analysis carry out in PPBstats regarding the objective : Compare different varieties evaluated for selection in different locations. D refers to designs and M to methods.
Once you have chosen your objective, analysis and experimental design, you can taste and measure … (section 4.2).
4.1.3 Workflow and function relations in PPBstats regarding organoleptic analysis
After designing the experiment and describing the data, each family of analysis is implemented by several analysis with the same workflow :
- Format the data
- Run the model
- Check the model and visualize outputs
- Compare means, format data for biplot and visualize outputs
Figure 4.2 displays the functions and their relationships. Table 4.1 describes each of the main functions.
You can have more information for each function by typing ?function_name in your R session.
Note that check_model(), mean_comparison(), biplot_data() and plot() are S3 method.
Therefore, you should type ?check_model, ?mean_comparison, ?biplot_data or ?plot.PPBstats to have general features and then see in details for specific functions.
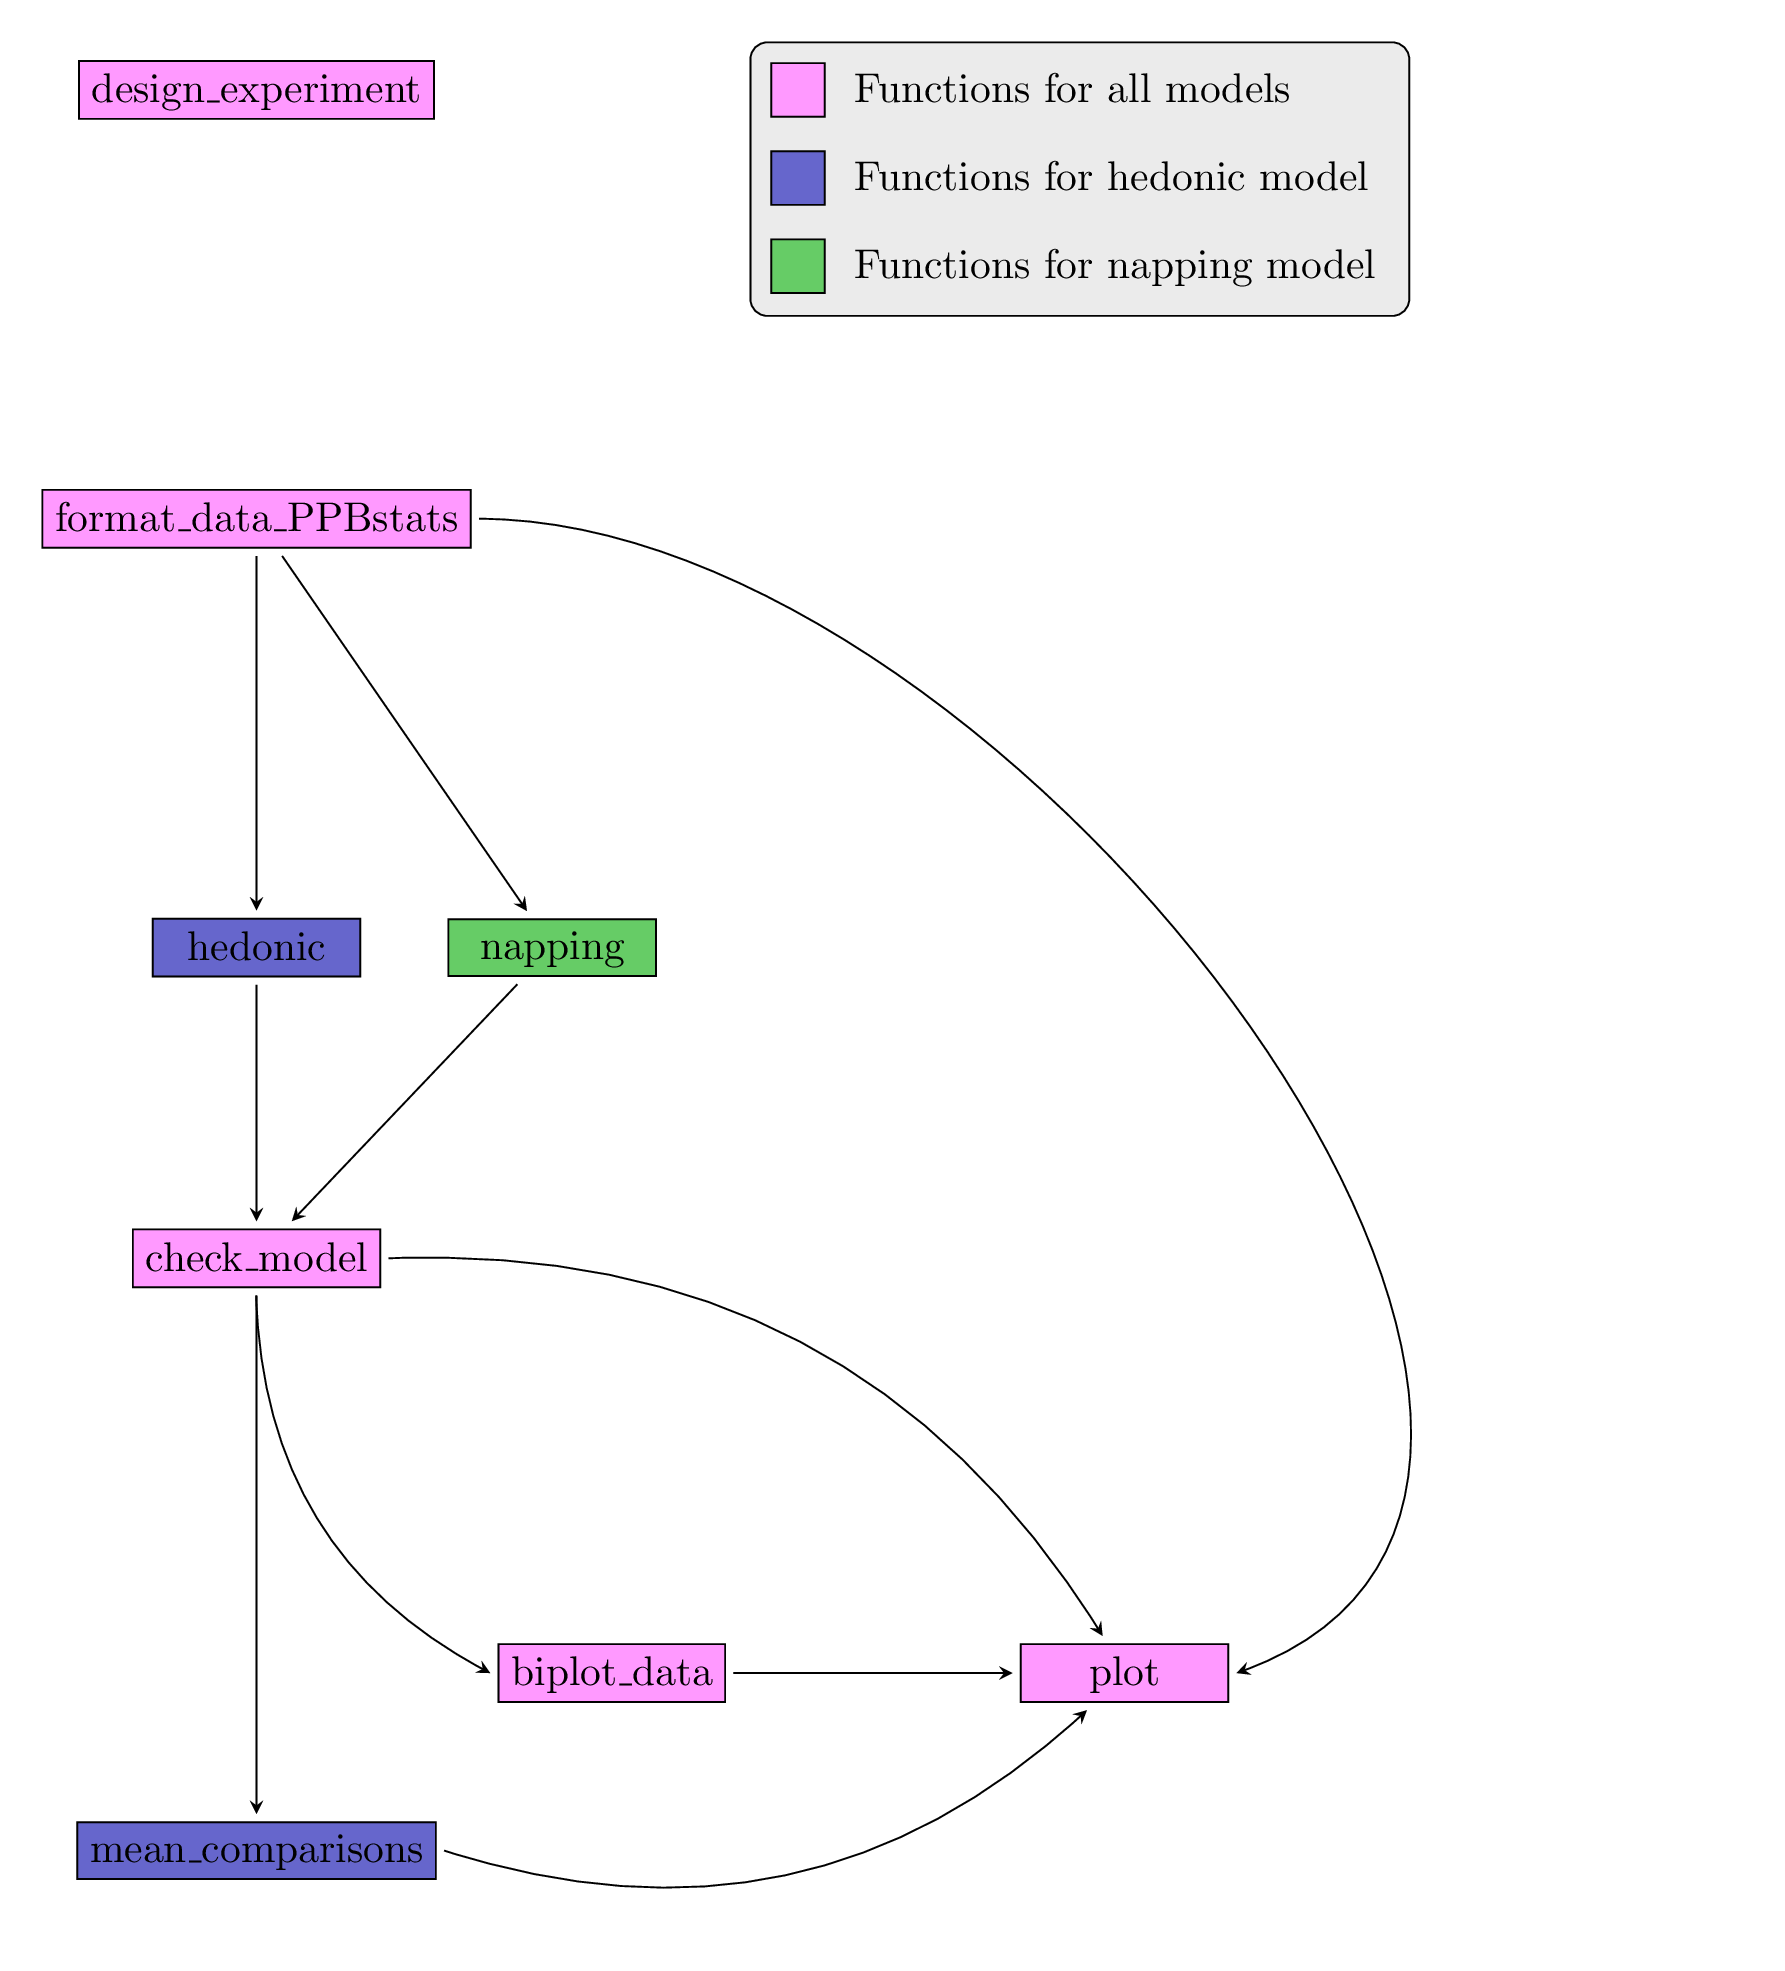
Figure 4.2: Main functions used in the workflow.
| function name | description |
|---|---|
design_experiment |
Provides experimental design for the different situations corresponding to the choosen family of analysis |
format_data_PPBstats |
Check and format the data to be used in PPBstats functions |
describe_data |
Describe the data set in order to choose the appropriate analysis to carry out |
hedonic |
Run hedonic analysis |
napping |
Run napping anaysis |
rank |
Run rank analysis |
check_model |
Check if the model went well |
mean_comparisons |
Get mean comparisons |
biplot_data |
Format multivariate results |
plot |
Build ggplot objects to visualize output |
4.1.4 Data format
For organoleptic analysis data must have a specific format. Each format is displayed in the corresponding analysis section.