3.9 Family 5 of analysis : multivariate analysis
Multivariate analysis can answer to multiple objective. One of them can be to study diversity structure and identify parents to cross based on either good complementarity or similarity for some traits
3.9.1 Decision tree
To study diversity structure and identify parents to cross based on either good complementarity or similarity for some traits, different scenario are possible (Figure 3.29). It can be completed by analysis of molecular data and genetic distance trees (M3, section 5).
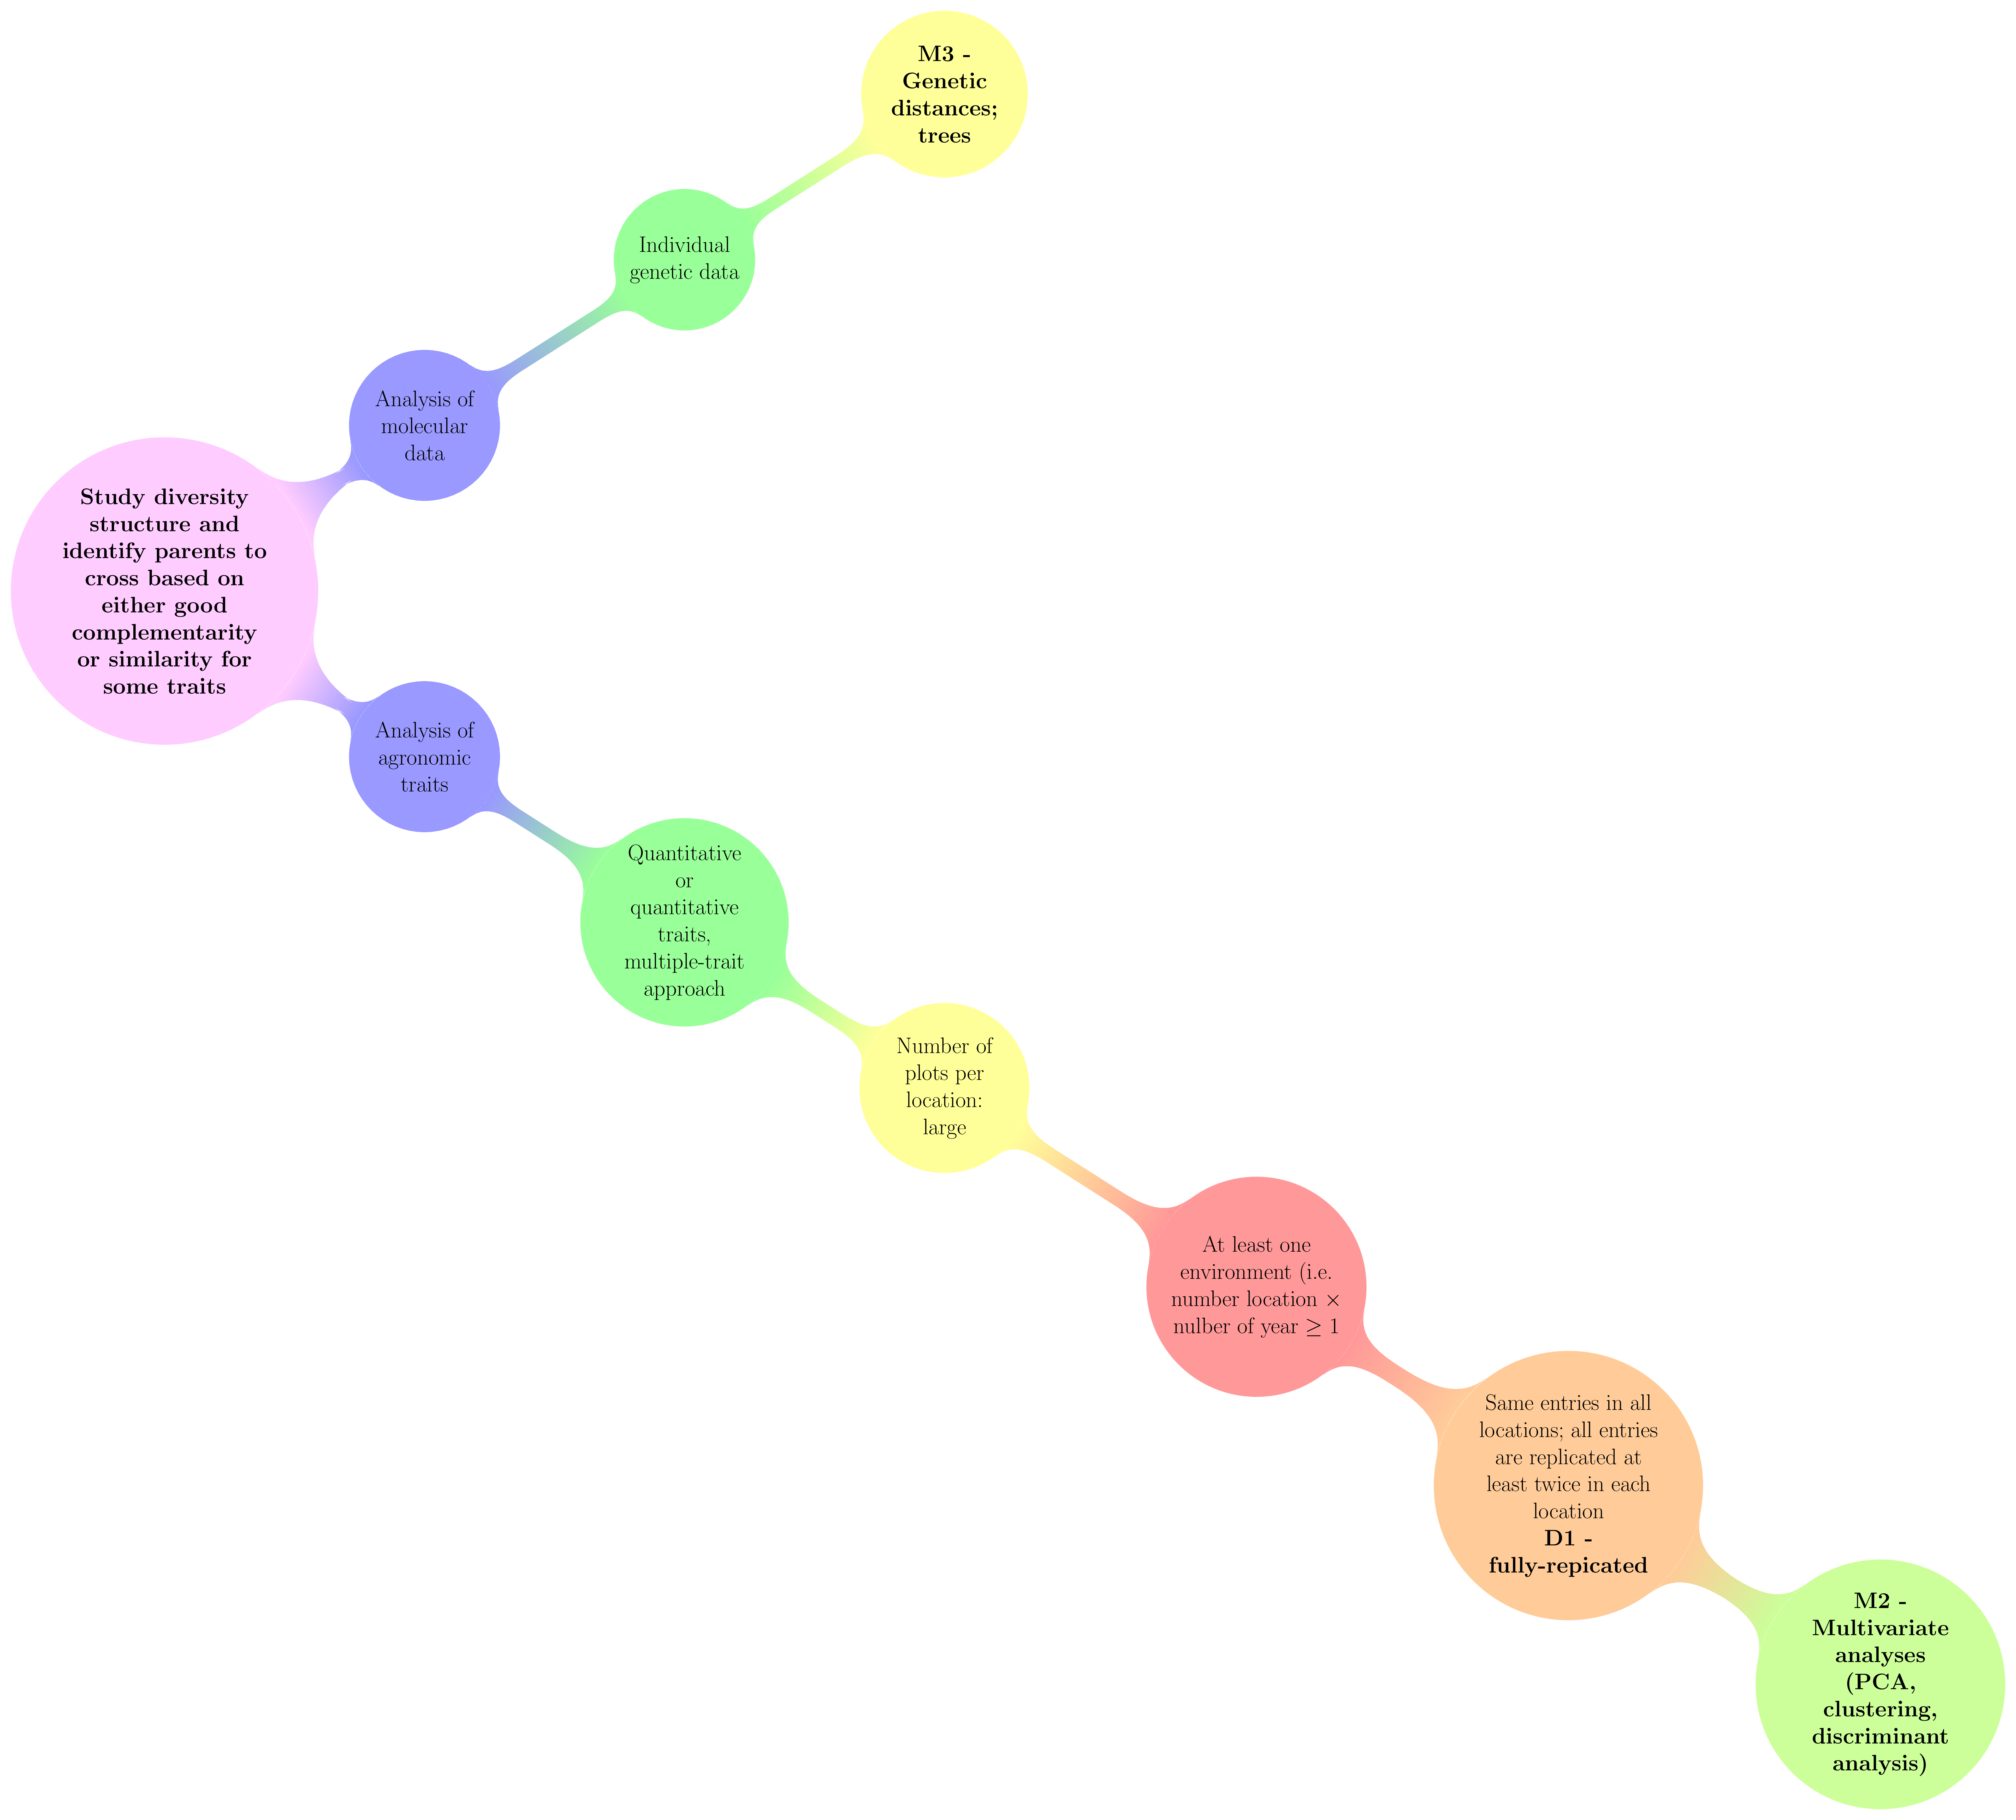
Figure 3.29: Decision tree with experimental constraints, designs and methods of agronomic analysis carry out in PPBstats regarding the objective :Study diversity structure and identify parents to cross based on either good complementarity or similarity for some traits. D refers to designs and M to methods.
3.9.2 Workflow and function relations in PPBstats regarding family 2 of analysis
Figure 3.30 displays the functions and their relationships. Table 3.6 describes each of the main functions.
You can have more information for each function by typing ?function_name in your R session.
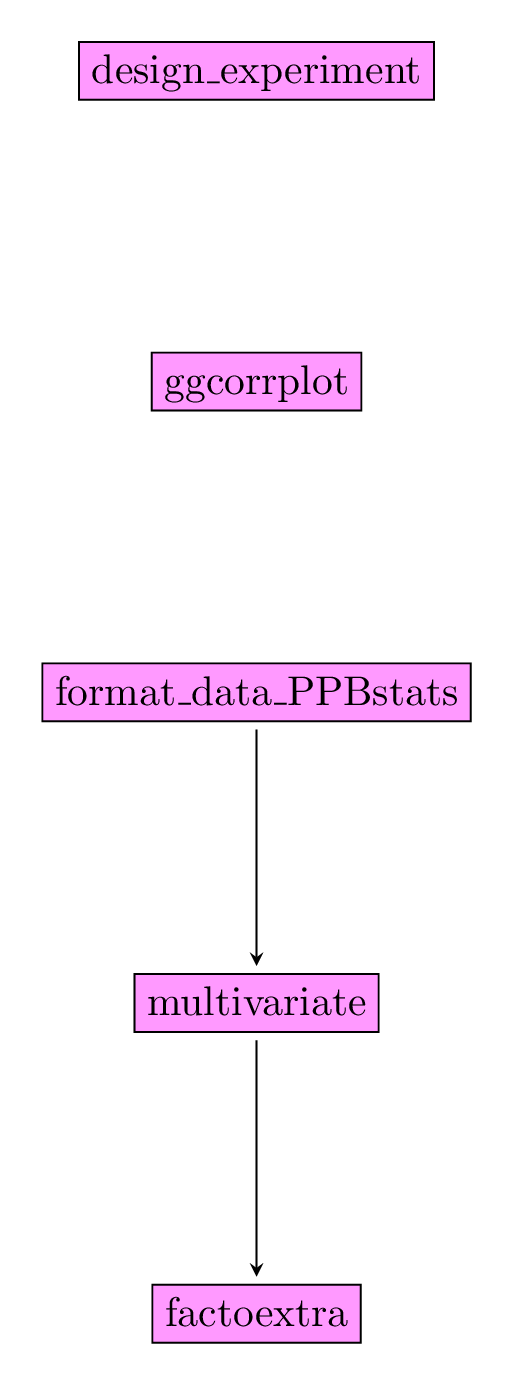
Figure 3.30: Main functions used in the workflow of family 5.
| function name | description |
|---|---|
design_experiment |
Provides experimental design for the different situations corresponding to the choosen family of analysis |
format_data_PPBstats |
Check and format the data to be used in PPBstats functions |
ggcorrplot |
Visualize correlation with ggcorrplot fonction from package ggcorrplot |
multivariate |
Run multivariate analysis with functions from FactoMineR |
factoextra |
Check outputs and results with the factoextra package |
3.9.3 Steps with PPBstats
For variance intra analysis, you can follow these steps (Figure 3.2) :
3.9.4 Format the data
data("data_model_GxE")
data_model_GxE = format_data_PPBstats(data_model_GxE, type = "data_agro")
## data has been formated for PPBstats functions.3.9.5 Look at correlation
library(ggcorrplot)
vec_variables = c("y1", "y2", "y3")
corr = round(cor(data_model_GxE[,vec_variables]), 1)
p.mat = cor_pmat(data_model_GxE[,vec_variables])

# Barring the no significant coefficient
ggcorrplot(corr, hc.order = TRUE, type = "lower", p.mat = p.mat)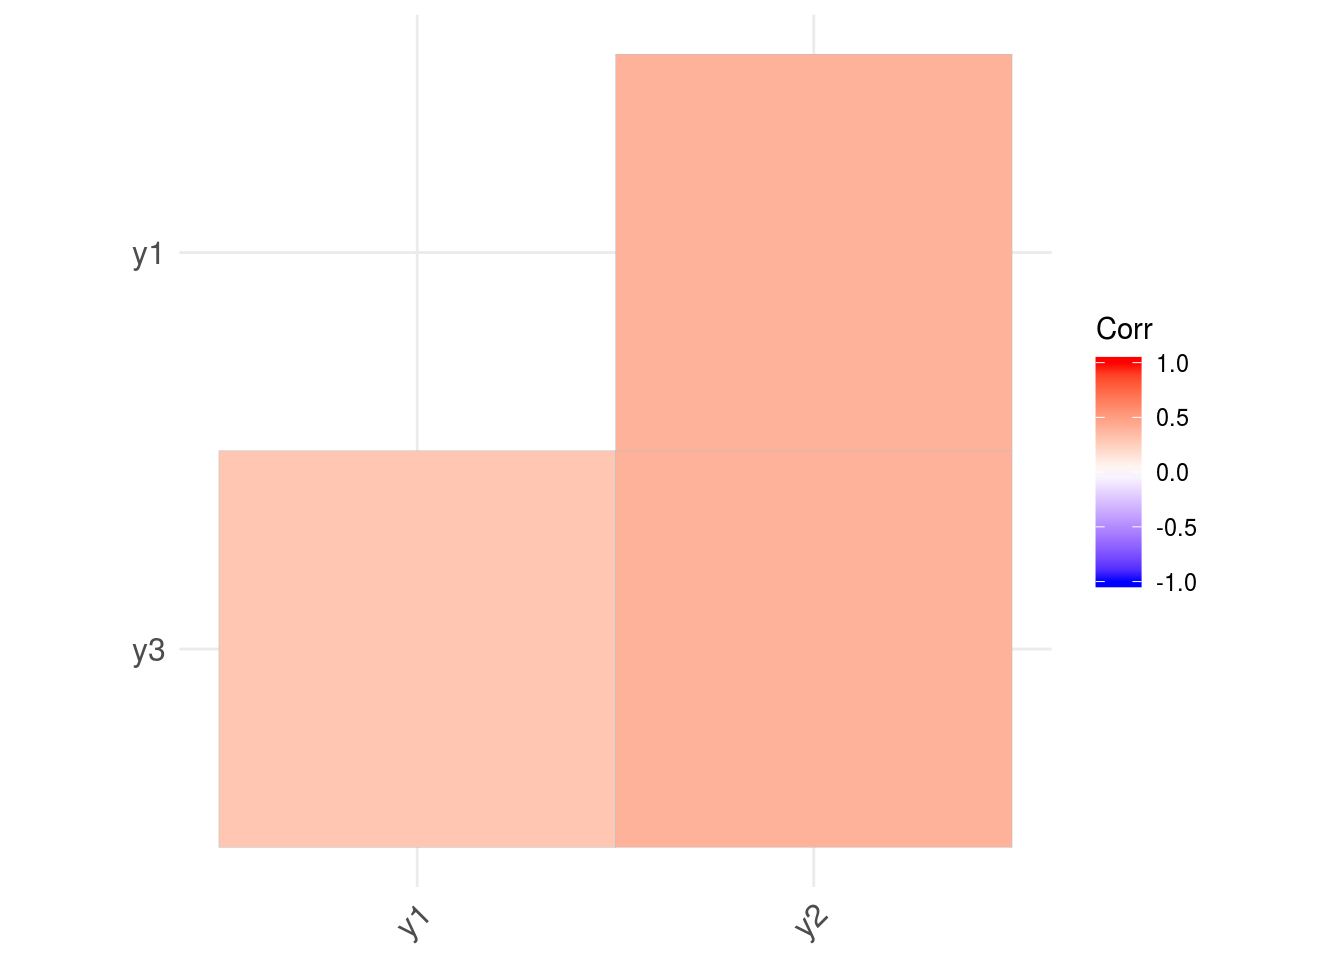
More details on the use of ggcorrplot() can be found here.
3.9.6 Run the analysis
vec_variables = c("y1", "y2", "y3")
res.pca = mutlivariate(data_model_GxE, vec_variables, PCA)
3.9.7 Check outputs and results
Look at the results thanks to the factoextra package:
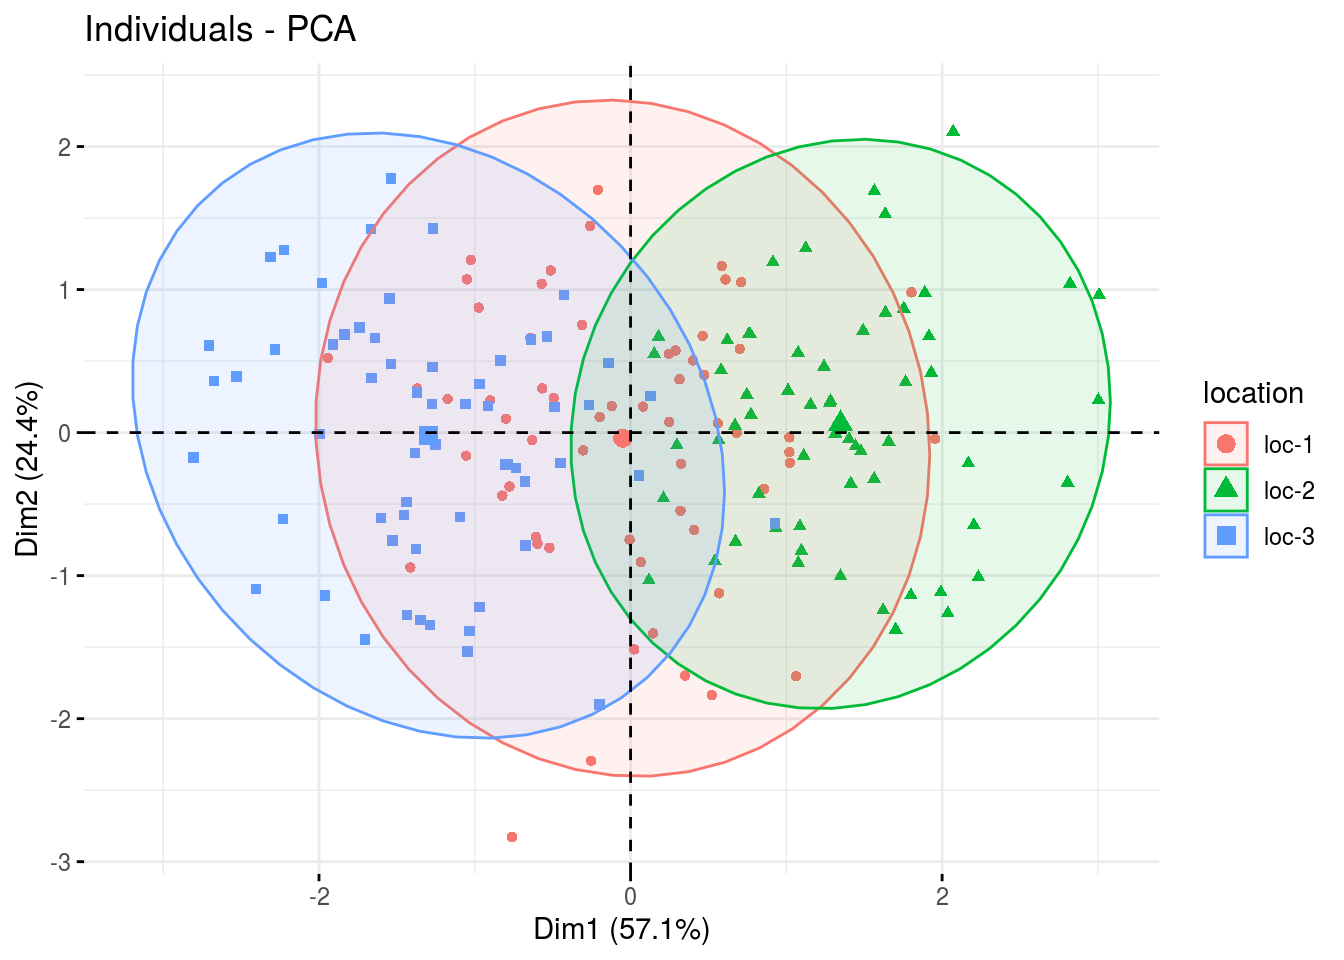
fviz_eig(res.pca)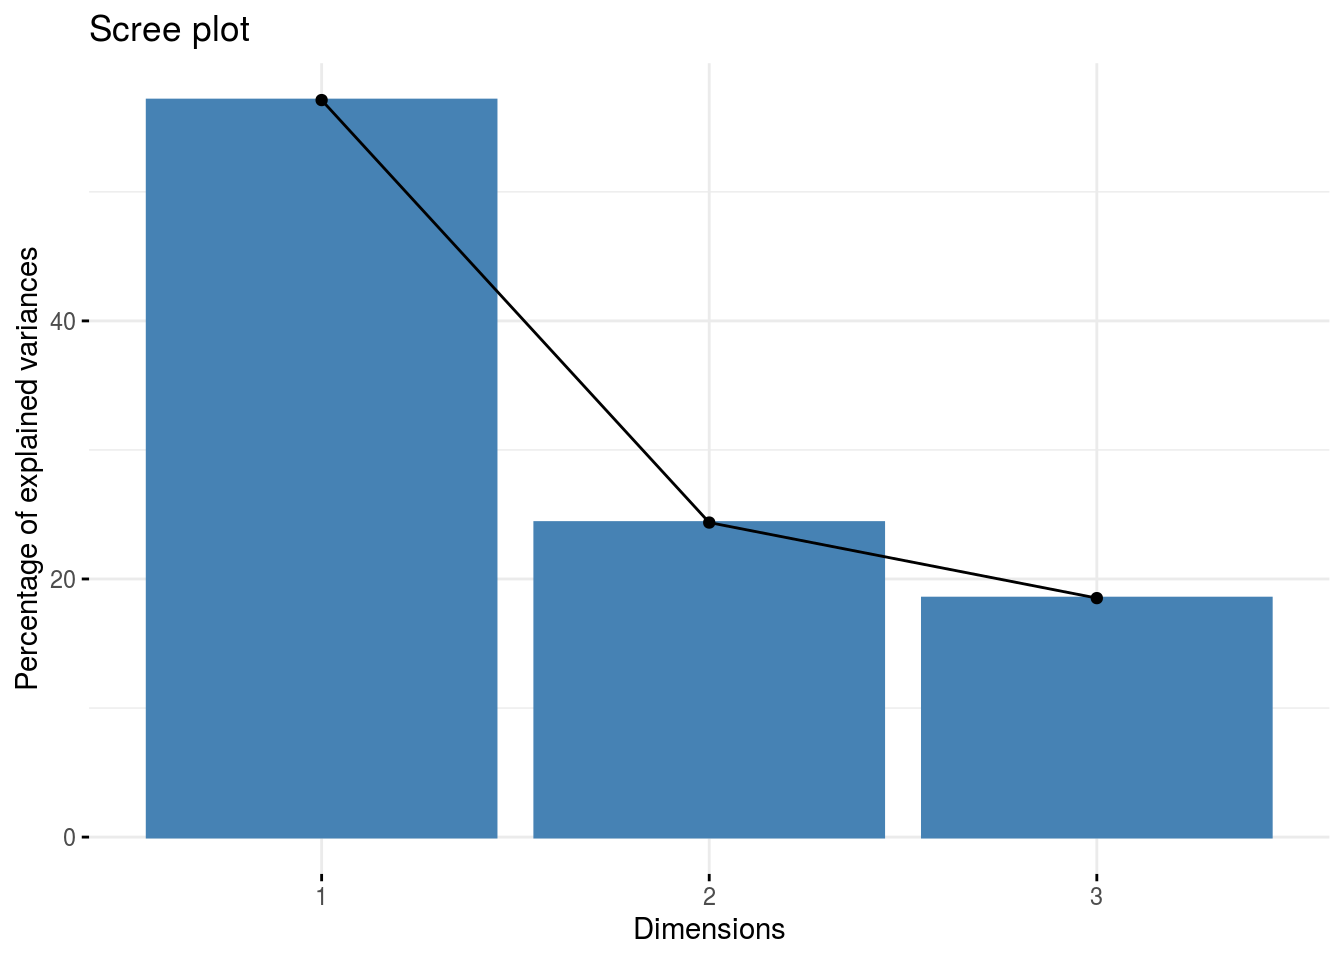
fviz_pca_ind(res.pca, label="none", habillage="location", addEllipses=TRUE, ellipse.level=0.95)