3.5 Family 1 of analysis : Compare different varieties evaluated for selection in different locations.
Family 1 gathers analyses that estimate entry effects. It allows to compare different entries on each location and test for significant differences among entries. Specific analysis including response to selection can also be done. The objective to compare different germplasms on each location for selection.
3.5.1 Decision tree
To compare different germplasms on each location for selection, different scenarios are possible (Figure 3.22) :
- classic anova (M4a, section 3.5.3) based on on fully replicated designs (D1, section 3.2.1),
- spatial analysis (M4b, section 3.5.4) based on row-column designs (D3, section 3.2.3),
- mixed models (M5, section3.5.5) for incomplete blocks designs (D2, section 3.2.2),
- bayesian hierarchical model intra-location (M7a, section 3.5.6) based on satellite-regional farms designs (D4, section 3.2.4).
It can be completed by organoleptic analysis (section 4). Based on these analysis, specific objective including response to selection analysis can also be done.
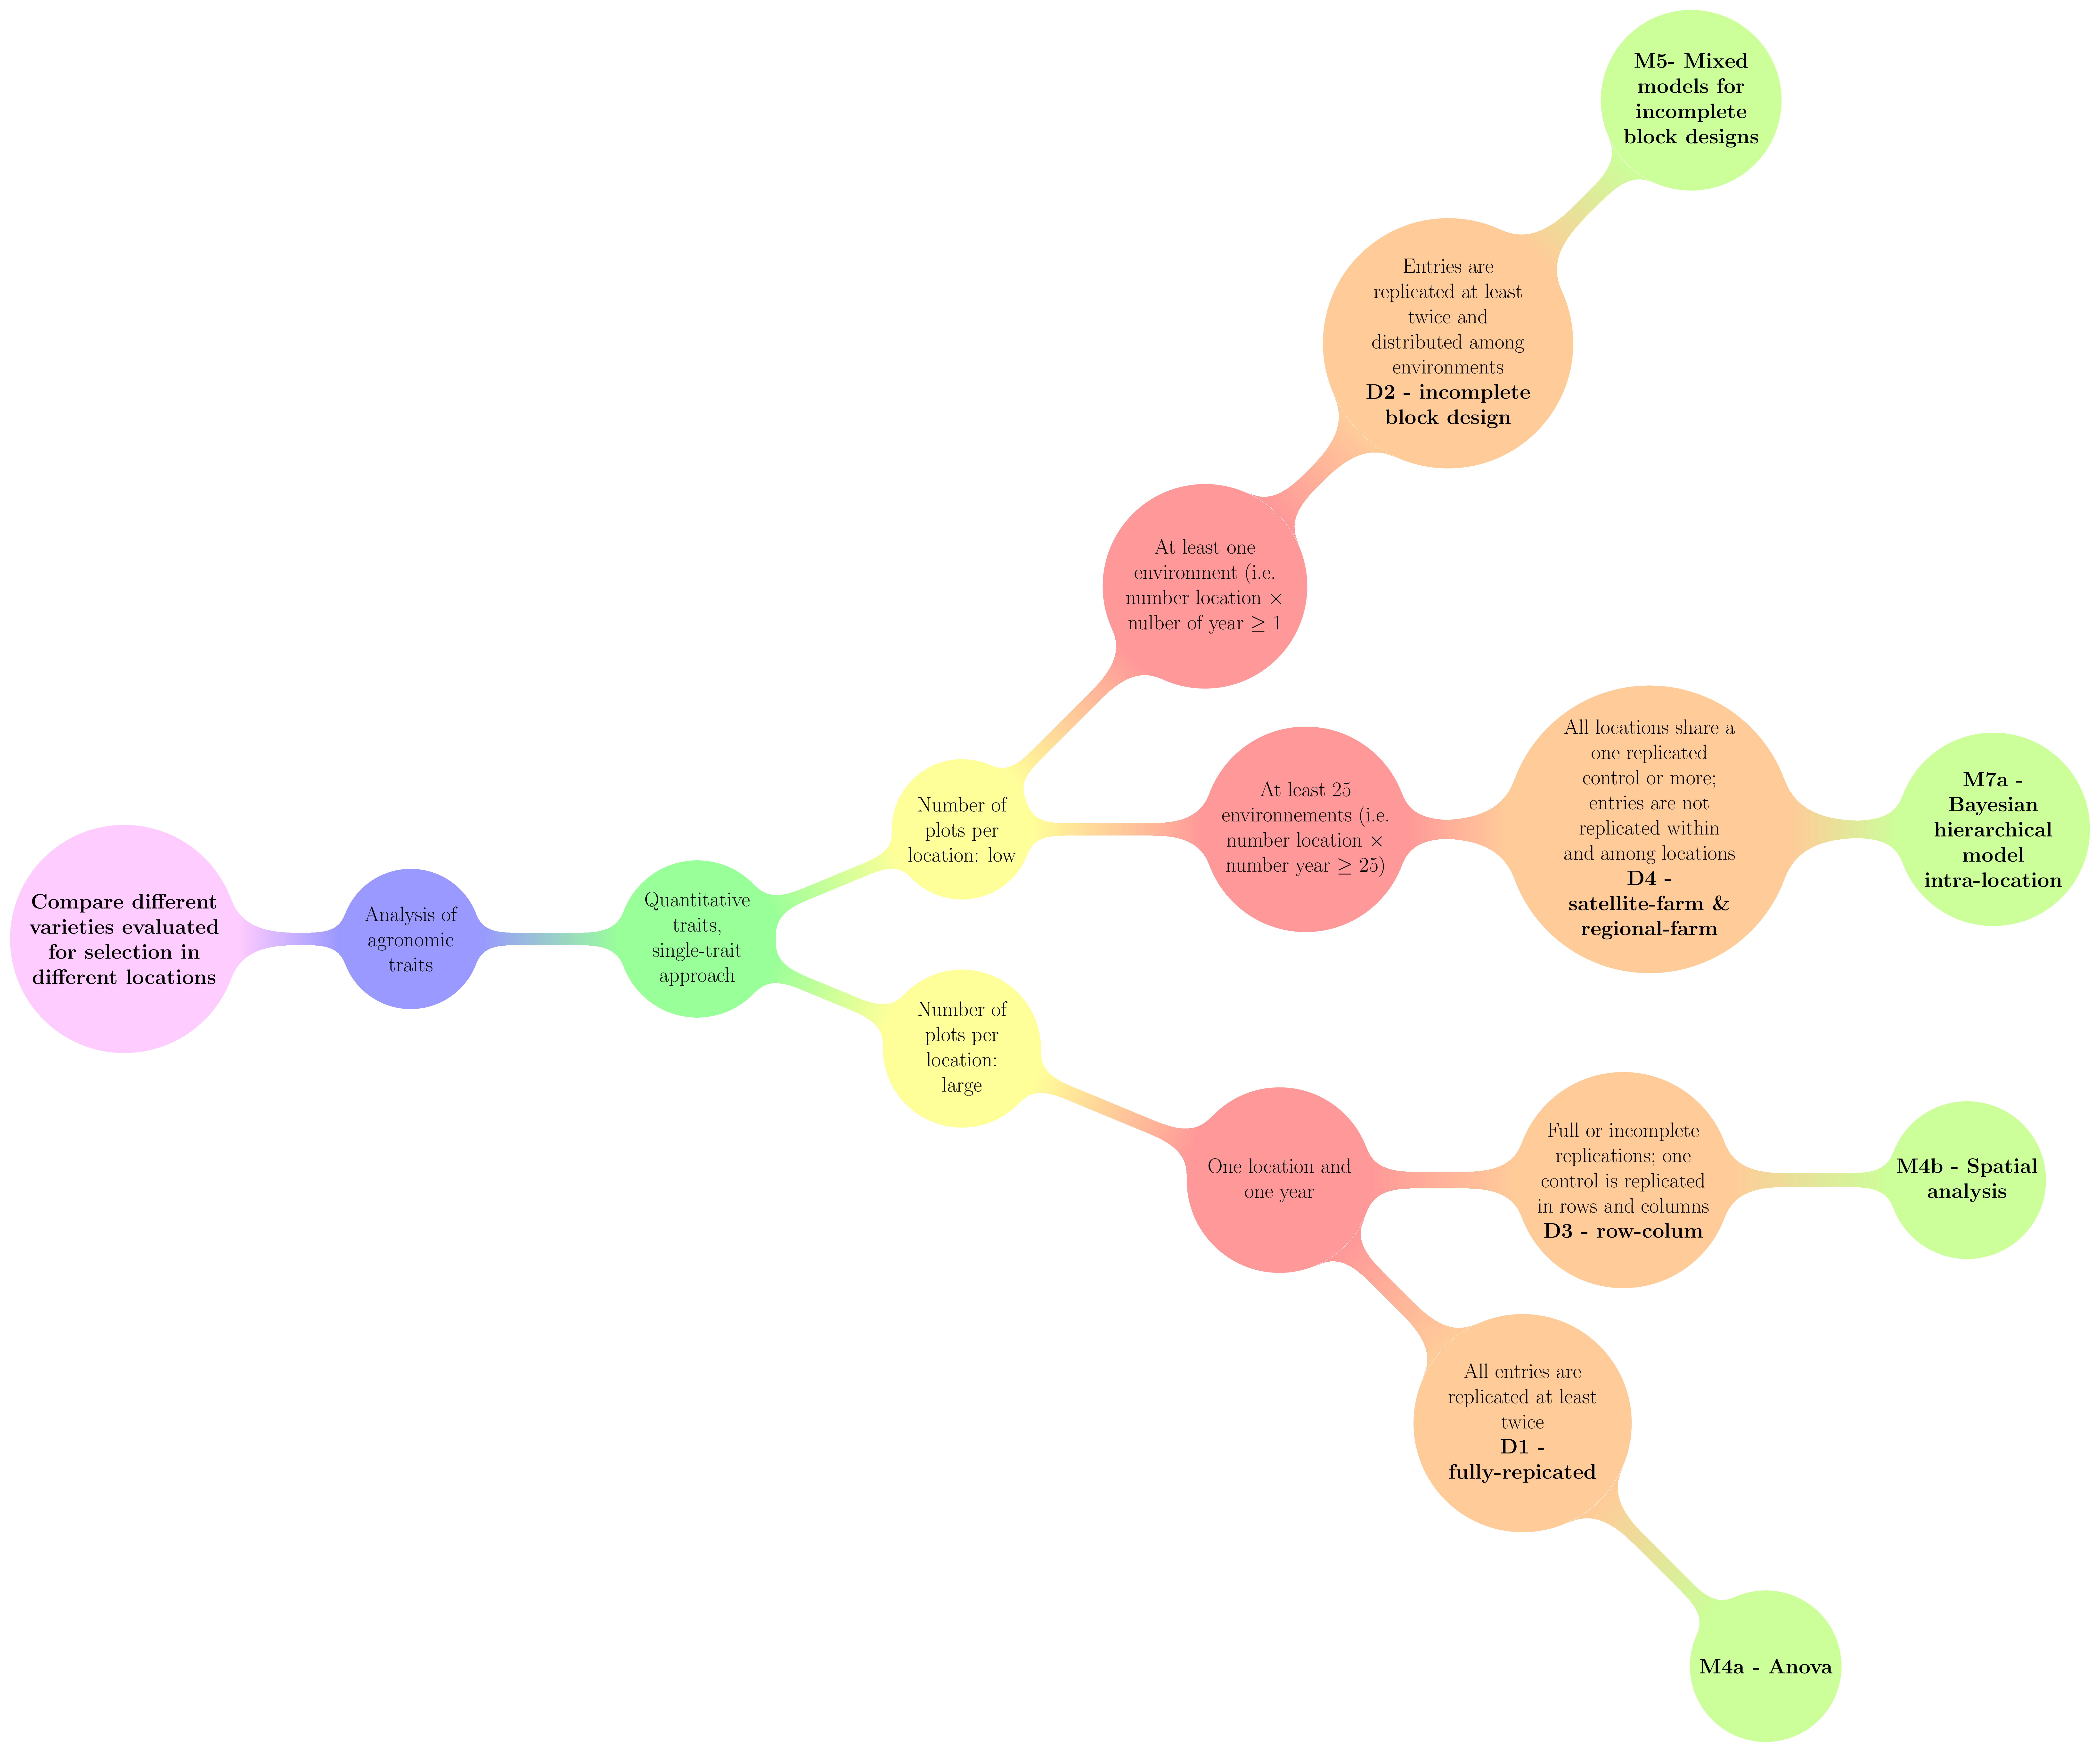
Figure 3.22: Decision tree with experimental constraints, designs and methods of agronomic analysis carry out in PPBstats regarding the objective : Compare different varieties evaluated for selection in different locations. D refers to designs and M to methods.
3.5.2 Workflow and function relations in PPBstats regarding family 1 of analysis
Figure 3.23 displays the functions and their relationships. Table 3.2 describes each of the main functions.
You can have more information for each function by typing ?function_name in your R session.
Note that check_model(), mean_comparison() and plot() are S3 method.
Therefore, you should type ?check_model, ?mean_comparison or ?plot.PPBstats to have general features and then see in details for specific functions.
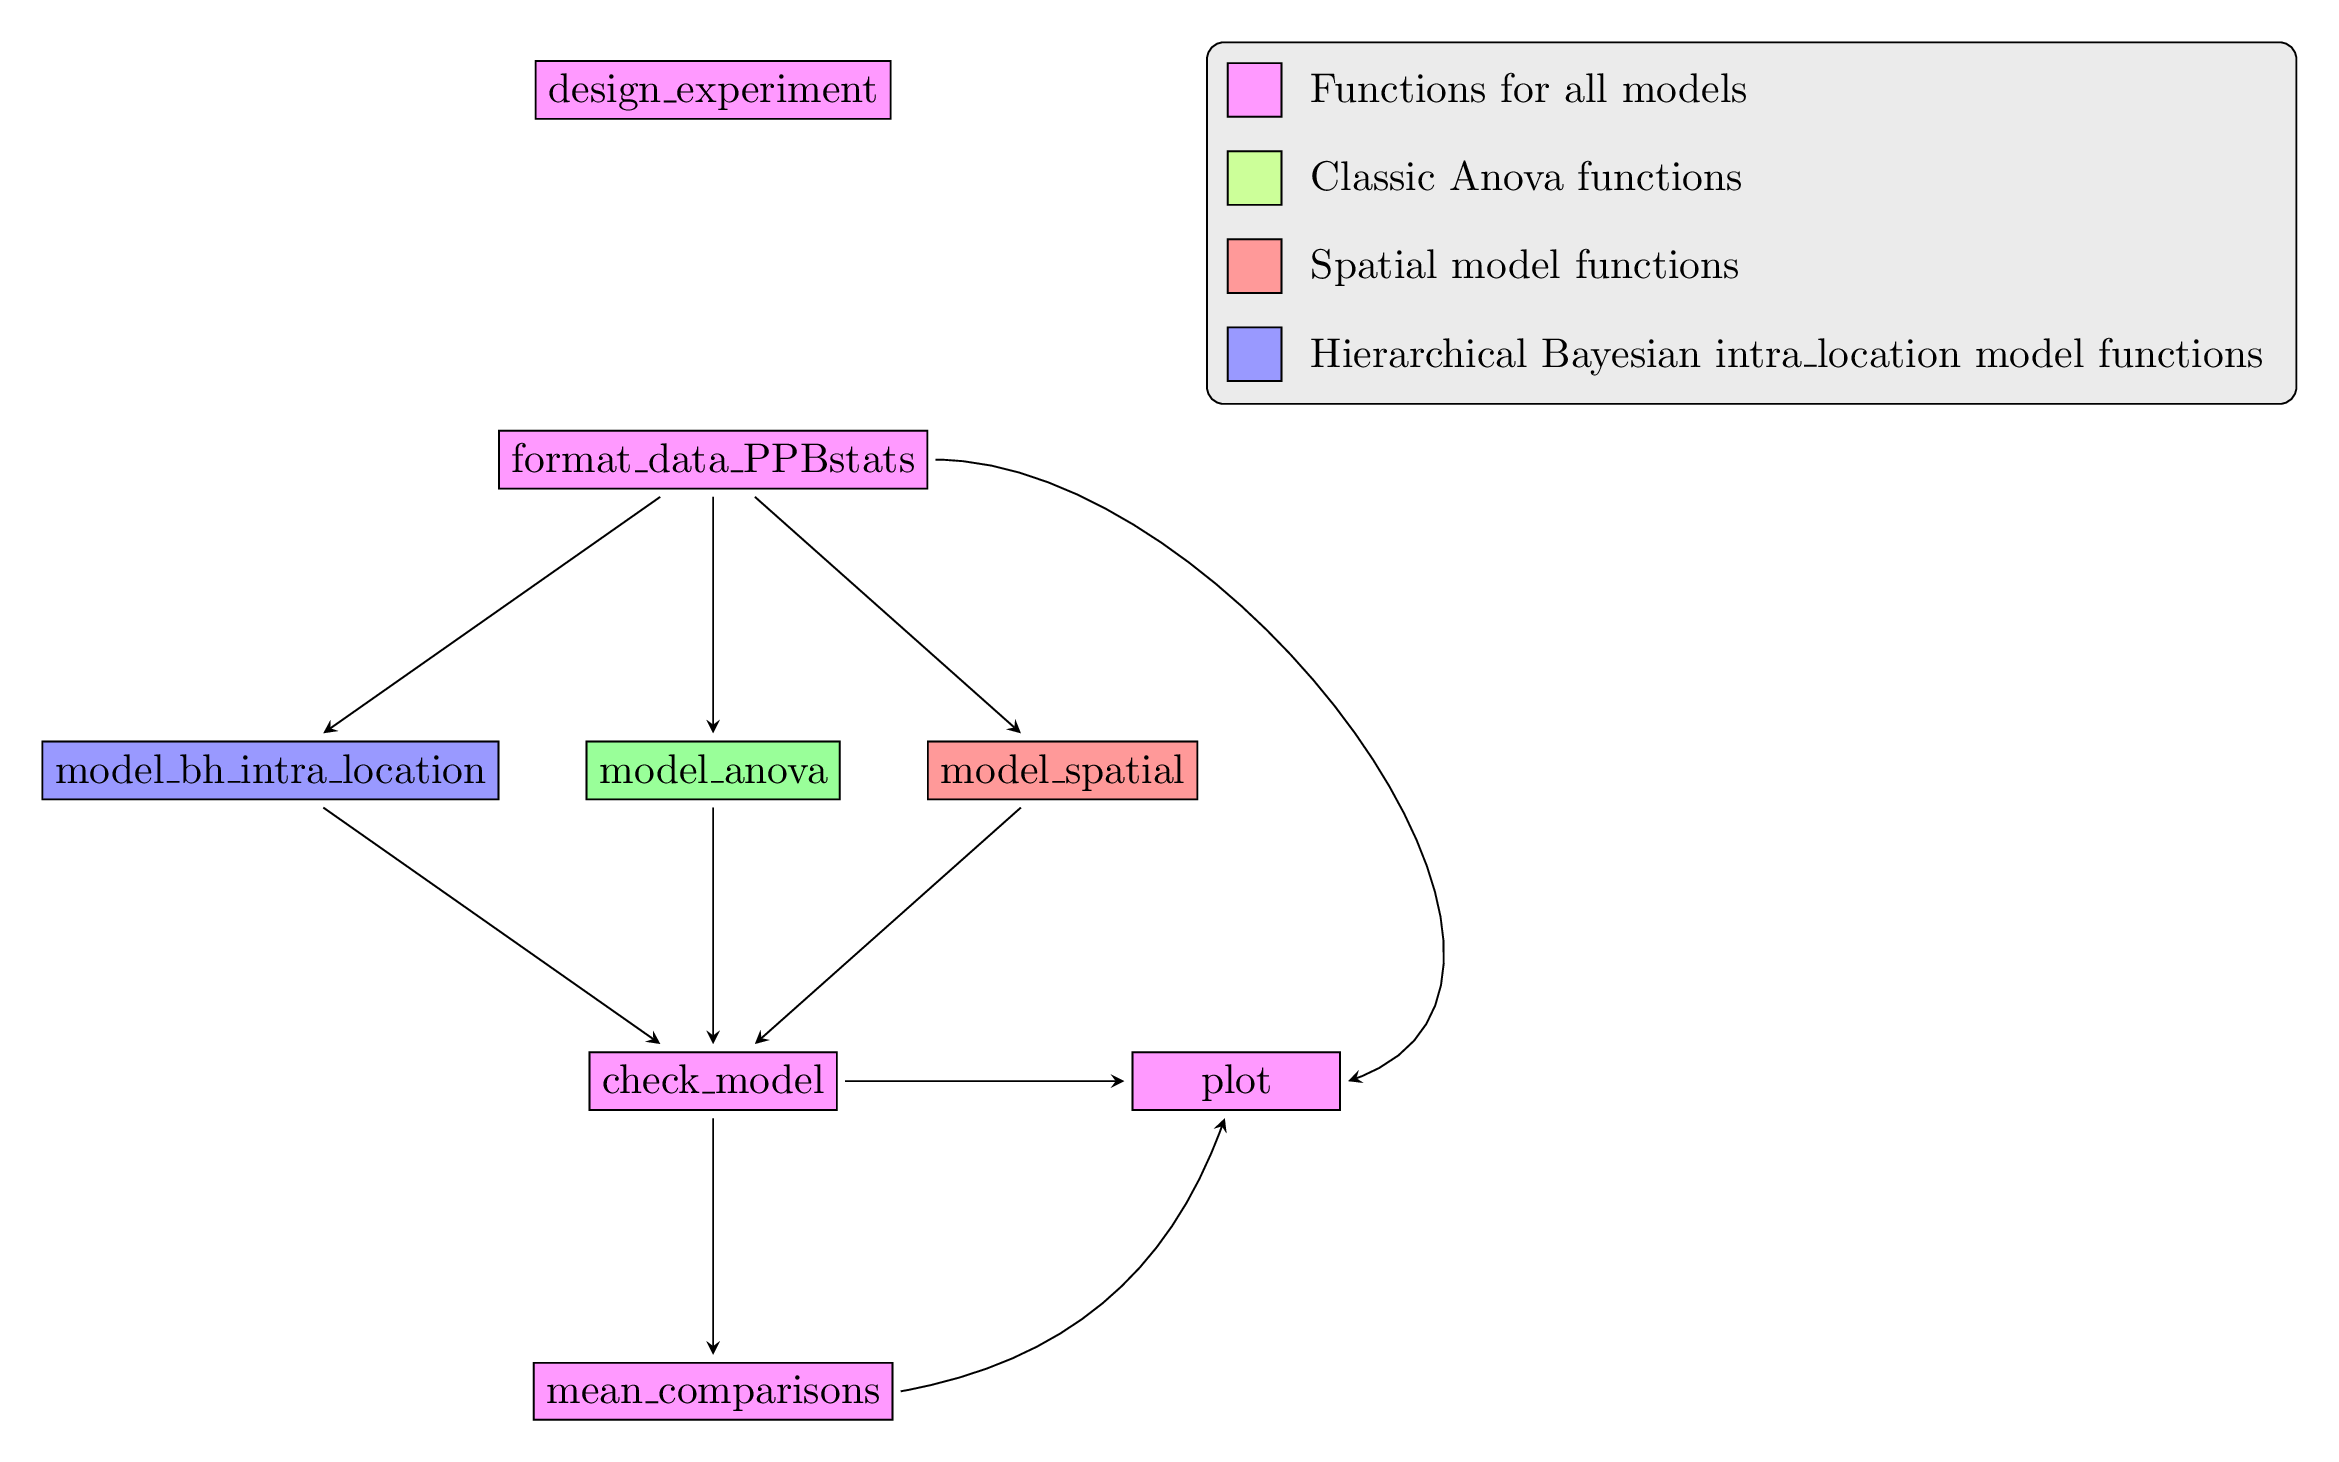
Figure 3.23: Main functions used in the workflow of family 1.
| function name | description |
|---|---|
design_experiment |
Provides experimental design for the different situations corresponding to the choosen family of analysis |
format_data_PPBstats |
Check and format the data to be used in PPBstats functions |
model_bh_intra-location |
Run Hierarchical Bayesian intra-location model |
model_spatial |
Run spatial row and column model |
model_anova |
Run classic anova model |
check_model |
Check if the model went well |
mean_comparisons |
Get mean comparisons |
plot |
Build ggplot objects to visualize output |
3.5.3 Classic ANOVA (M4a)
3.5.3.1 Theory of the model
The experimental design used is fully replicated (D1) on one location. The model is based on frequentist statistics (section 3.1.2.1). The tests to check the model are explained in section 3.1.2.1.2. The method to compute mean comparison are explained in section 3.1.2.1.3. The analysis is done the following model :
\(Y_{ijk} = \mu + \alpha_{i} + rep_{k} + \varepsilon_{ijk}; \quad \varepsilon_{ijk} \sim \mathcal{N} (0,\sigma^2)\)
With,
- \(Y_{ijk}\) the phenotypic value for replication \(k\), germplasm \(i\) and individual \(j\),
- \(\mu\) the general mean,
- \(\alpha_{i}\) the effect of germplasm \(i\),
- \(rep_{k}\) the effect of the replication \(k\),
- \(\varepsilon_{ijk}\) the residuals.
3.5.3.2 Steps with PPBstats
For classic anova analysis, you can follow these steps (Figure 3.2):
- Format the data with
format_data_PPBstats() - Run the model with
model_anova() - Check model outputs to know if you can continue the analysis with
check_model()and vizualise it withplot() - Get mean comparisons for each factor with
mean_comparisons()and vizualise it withplot()
3.5.3.3 Format the data
A subset of data_model_GxE is used in this exemple.
data(data_model_GxE)
data_model_anova = droplevels(dplyr::filter(data_model_GxE, location == "loc-1"))
data_model_anova = format_data_PPBstats(data_model_anova, type = "data_agro")
## data has been formated for PPBstats functions.head(data_model_anova)## seed_lot location long lat year germplasm block
## 1 germ-12_loc-1_2005_0001 loc-1 0.616363 44.20314 2005 germ-12 1
## 2 germ-1_loc-1_2005_0001 loc-1 0.616363 44.20314 2005 germ-1 1
## 3 germ-18_loc-1_2005_0001 loc-1 0.616363 44.20314 2005 germ-18 1
## 4 germ-14_loc-1_2005_0001 loc-1 0.616363 44.20314 2005 germ-14 1
## 5 germ-6_loc-1_2005_0001 loc-1 0.616363 44.20314 2005 germ-6 1
## 6 germ-4_loc-1_2005_0001 loc-1 0.616363 44.20314 2005 germ-4 1
## X Y y1 y1$date y2 y2$date y3 y3$date desease
## 1 A 1 14.32724 2017-07-15 41.85377 2017-07-15 66.05498 2017-07-15 low
## 2 A 2 23.03428 2017-07-15 37.38970 2017-07-15 63.39528 2017-07-15 low
## 3 A 3 24.91349 2017-07-15 38.38628 2017-07-15 60.52710 2017-07-15 high
## 4 A 4 24.99078 2017-07-15 39.72205 2017-07-15 60.80393 2017-07-15 low
## 5 A 5 18.95340 2017-07-15 46.60443 2017-07-15 53.71210 2017-07-15 high
## 6 B 1 21.31660 2017-07-15 49.94656 2017-07-15 60.71978 2017-07-15 medium
## vigor y1$date_julian y2$date_julian y3$date_julian
## 1 l 195 195 195
## 2 l 195 195 195
## 3 h 195 195 195
## 4 l 195 195 195
## 5 m 195 195 195
## 6 l 195 195 1953.5.3.4 Run the model
To run model on the dataset, used the function model_anova.
You can run it on one variable.
out_anova = model_anova(data_model_anova, variable = "y1")out_anova is a list containing two elements :
info: a list with variable
out_anova$info## $variable
## [1] "y1"ANOVAa list with two elements :model
out_anova$ANOVA$model## ## Call: ## stats::lm(formula = variable ~ germplasm + block, data = data) ## ## Coefficients: ## (Intercept) germplasm1 germplasm2 germplasm3 germplasm4 ## 20.26702 1.60183 0.02397 -0.39822 1.21183 ## germplasm5 germplasm6 germplasm7 germplasm8 germplasm9 ## 1.06590 3.76010 -5.10761 -0.92696 2.63546 ## germplasm10 germplasm11 germplasm12 germplasm13 germplasm14 ## 0.42415 1.56248 -5.76240 -4.62059 0.47600 ## germplasm15 germplasm16 germplasm17 germplasm18 germplasm19 ## 1.43492 -1.55346 0.89022 0.39441 1.16307 ## block1 block2 ## -0.93928 -0.22936anova_model
out_anova$ANOVA$anova_model## Analysis of Variance Table ## ## Response: variable ## Df Sum Sq Mean Sq F value Pr(>F) ## germplasm 19 361.54 19.028 0.5090 0.9414 ## block 2 46.01 23.006 0.6154 0.5457 ## Residuals 38 1420.67 37.386germplasm_effectsa list of two elements :effects
out_anova$ANOVA$germplasm_effects$effects## germ-1 germ-10 germ-11 germ-12 germ-13 germ-14 ## 1.60183489 0.02396579 -0.39821799 1.21183407 1.06590372 3.76009917 ## germ-15 germ-16 germ-17 germ-18 germ-19 germ-2 ## -5.10761419 -0.92695642 2.63546203 0.42415203 1.56247594 -5.76239571 ## germ-20 germ-3 germ-4 germ-5 germ-6 germ-7 ## -4.62059183 0.47600360 1.43491926 -1.55346262 0.89022028 0.39441135 ## germ-8 germ-9 ## 1.16306897 1.72488766intra_variance
out_anova$ANOVA$germplasm_effects$intra_variance## germ-1 germ-10 germ-11 germ-12 germ-13 germ-14 ## 14.550965 204.517046 28.558887 45.376513 51.105885 3.216895 ## germ-15 germ-16 germ-17 germ-18 germ-19 germ-2 ## 21.434155 19.650429 28.827606 24.862755 80.733922 2.938909 ## germ-20 germ-3 germ-4 germ-5 germ-6 germ-7 ## 17.722408 43.102002 10.437349 37.931023 13.113586 44.667769 ## germ-8 germ-9 ## 7.226053 10.361250
3.5.3.5 Check and visualize model outputs
The tests to check the model are explained in section 3.1.2.1.2.
3.5.3.5.1 Check the model
Once the model is run, it is necessary to check if the outputs can be taken with confidence.
This step is needed before going ahead in the analysis (in fact, object used in the next functions must come from check_model()).
out_check_anova = check_model(out_anova)out_check_anova is a list containing four elements :
info: a list with variablemodel_anovathe output from the modeldata_ggplota list containing information for ggplot:data_ggplot_residualsa list containing :data_ggplot_normalitydata_ggplot_skewness_testdata_ggplot_kurtosis_testdata_ggplot_shapiro_testdata_ggplot_qqplot
data_ggplot_variability_repartition_piedata_ggplot_var_intra
3.5.3.5.2 Visualize outputs
Once the computation is done, you can visualize the results with plot()
p_out_check_anova = plot(out_check_anova)p_out_check_anova is a list with:
residualshistogram: histogram with the distribution of the residuals
p_out_check_anova$residuals$histogram## `stat_bin()` using `bins = 30`. Pick better value with `binwidth`.
qqplot
p_out_check_anova$residuals$qqplot
points
p_out_check_anova$residuals$points
variability_repartition: pie with repartition of SumSq for each factor
p_out_check_anova$variability_repartition
variance_intra_germplasm: repartition of the residuals for each germplasm (see Details for more information) With the hypothesis than the micro-environmental variation is equaly distributed on all the individuals (i.e. all the plants), the distribution of each germplasm represent the intra-germplasm variance. This has to been seen with caution:- If germplasm have no intra-germplasm variance (i.e. pure line or hybrides) then the distribution of each germplasm represent only the micro-environmental variation.
- If germplasm have intra-germplasm variance (i.e. population such as landraces for example) then the distribution of each germplasm represent the micro-environmental variation plus the intra-germplasm variance.
p_out_check_anova$variance_intra_germplasm
3.5.3.6 Get and visualize mean comparisons
The method to compute mean comparison are explained in section 3.1.2.1.3.
3.5.3.6.1 Get mean comparisons
Get mean comparisons with mean_comparisons().
out_mean_comparisons_anova = mean_comparisons(out_check_anova, p.adj = "bonferroni")out_mean_comparisons_anova is a list of two elements:
info: a list with variabledata_ggplot_LSDbarplot_germplasm
3.5.3.6.2 Visualize mean comparisons
p_out_mean_comparisons_anova = plot(out_mean_comparisons_anova)p_out_mean_comparisons_anova is a list of one element with barplots :
For each element of the list, there are as many graph as needed with nb_parameters_per_plot parameters per graph.
Letters are displayed on each bar. Parameters that do not share the same letters are different regarding type I error (alpha) and alpha correction.
The error I (alpha) and the alpha correction are displayed in the title.
germplasm: mean comparison for germplasm
pg = p_out_mean_comparisons_anova$germplasm
names(pg)
## [1] "1" "2" "3"pg$`1`
3.5.3.7 Get and vizualise groups of parameters
3.5.3.7.1 Get groups of parameters
In order to cluster locations or germplasms, you may use mulivariate analysis on a matrix with several variables in columns and parameter in rows.
This is done with parameter_groups() which do a PCA on this matrix.
Clusters are done based on HCPC method as explained here
Lets’ have an example with three variables.
First run the models
out_anova_2 = model_anova(data_model_anova, variable = "y2")
out_anova_3 = model_anova(data_model_anova, variable = "y3")
Then check the models
out_check_anova_2 = check_model(out_anova_2)
out_check_anova_3 = check_model(out_anova_3)
Then run the function for germplasm.
out_parameter_groups = parameter_groups(
  list("y1" = out_check_anova, "y2" = out_check_anova_2, "y3" = out_check_anova_3),
  "germplasm"
  )
out_parameter_groups is list of two elements:
obj.pca: the PCA object fromFactoMineR::PCA()clust, a list of two elements:res.hcpc: the HCPC object fromFactoMineR::HCPC()clust: the dataframe with cluster assigned to each individual
3.5.3.7.2 Visualize groups of parameters
Visualize outputs with plot
p_germplasm_group = plot(out_parameter_groups)p_germplasm_group is list of two elements :
pca: a list with three elements on the PCA on the group of parameters :composante_variance: variance caught by each dimension of the PCA
p_germplasm_group$pca$composante_variance
ind: graph of individuals
p_germplasm_group$pca$ind
var: graph of variables
p_germplasm_group$pca$var
clust: output fromfactextra::fviz_cluster(), a list of number of cluster + 1 element
cl = p_germplasm_group$clust
names(cl)
## [1] "cluster_all" "cluster_1" "cluster_2" "cluster_3"cl$cluster_all
cl$cluster_1## Warning: Removed 3 rows containing non-finite values (stat_mean).## Warning: Removed 3 rows containing missing values (geom_point).## Warning: Removed 3 rows containing missing values (geom_text_repel).
3.5.3.8 post hoc analysis to visualize variation repartition for several variables
list_out_check_model = list("anova_1" = out_check_anova, "anova_2" = out_check_anova_2, "anova_3" = out_check_anova_3)
post_hoc_variation(list_out_check_model)
3.5.3.9 Apply the workflow to several variables
If you wish to apply the AMMI workflow to several variables, you can use lapply() with the following code :
workflow_anova = function(x, data){
  out_anova = model_anova(data, variable = x)

  out_check_anova = check_model(out_anova)
  p_out_check_anova = plot(out_check_anova)

  out_mean_comparisons_anova = mean_comparisons(out_check_anova, p.adj = "bonferroni")
  p_out_mean_comparisons_anova = plot(out_mean_comparisons_anova)

  out = list(
    "out_anova" = out_anova,
    "out_check_anova" = out_check_anova,
    "p_out_check_anova" = p_out_check_anova,
    "out_mean_comparisons_anova" = out_mean_comparisons_anova,
    "p_out_mean_comparisons_anova" = p_out_mean_comparisons_anova
  )

  return(out)
}

vec_variables = c("y1", "y2", "y3")

out = lapply(vec_variables, workflow_anova, data_model_anova)
names(out) = vec_variables

list_out_check_model = list("anova_1" = out$y1$out_check_anova, "anova_2" = out$y2$out_check_anova, "anova_3" = out$y3$out_check_anova)

out_parameter_groups = parameter_groups(list_out_check_model, "germplasm" )
p_germplasm_group = plot(out_parameter_groups)

p_post_hoc_variation = post_hoc_variation(list_out_check_model)
3.5.4 Spatial analysis (M4b)
3.5.4.1 Theory of the model
The experimental design used is the row-column design (D3). The following model is based on frequentist statistics (section 3.1.2.1). The model allows taking into account environmental variation within a block with few control replicated in rows and columns.
It is based on a SpATS (Spatial Analysis of Field Trials with Splines) model proposed by Rodrı'guez-Álvarez et al. (2016) :
\(Y_{ijk} = \alpha_{i} + r_{j} + c_{k} + f(u,v) + \varepsilon_{ijk}; \quad \varepsilon_{ijk} \sim \mathcal{N} (0,\sigma^2)\)
With,
- \(Y_{ijk}\) the phenotypic value for germplasm \(i\), row \(j\) and column \(k\)
- \(\alpha_{i}\) the random effect of germplasm \(i\)
- \(r_{j}\) the effect of row \(j\)
- \(c_{k}\) the effect of col \(k\)
- \(f(u,v)\) the smooth bivariate function that simultaneously accounts for the spatial trend across both directions of the fiel (i.e. rows and columns)
- \(\varepsilon_{ijk}\) the residuals
Note that \(f(u,v)\) is divided into 8 components excluding the intercept (Rodrı'guez-Álvarez et al. 2016):
- the linear effect of the rows (row),
- the linear effect of the columns (col),
- the linear interaction of rows and columns (row:col),
- the main row effect (f(row)),
- the main column effect (f(col)),
- the smooth varying coefficient term regarding rows (f(col):row),
- the smooth varying coefficient term regarding columns (row:f(col))),
- the smooth-by-smooth interaction component (f(col):f(row))
Much more information regarding the model as well as example of R package SpATS can be found in Rodrı'guez-Álvarez et al. (2016).
3.5.4.2 Steps with PPBstats
- Format the data with
format_data_PPBstats() - Run the model with
model_spatial() - Check model outputs with graphs to know if you can continue the analysis with
check_model()and vizualise it withplot() - Get mean comparisons for germplasms with
mean_comparisons()and vizualise it withplot()
3.5.4.3 Format the data
data("data_model_spatial")
data_model_spatial = format_data_PPBstats(data_model_spatial, type = "data_agro")
## Warning in format_data_PPBstats.data_agro(data): Column "long" is needed to
## get map and not present in data.## Warning in format_data_PPBstats.data_agro(data): Column "lat" is needed to
## get map and not present in data.## data has been formated for PPBstats functions.3.5.4.4 Run the model
By default, germplasm are settled as random.
out_spatial = model_spatial(data = data_model_spatial, variable = "y1")## Effective dimensions
## -------------------------
## It. Deviance germplasm col_f row_f f(col) f(row) f(col):row col:f(row)f(col):f(row)
## 1 499915783.828728 40.302 0.366 0.191 9.650 0.138 7.750 0.131 2.748
## 2 1810.537704 43.464 0.378 0.143 7.328 0.155 6.301 0.282 2.305
## 3 1805.922367 45.867 0.387 0.139 6.084 0.228 5.185 0.526 1.927
## 4 1802.131778 47.949 0.400 0.148 5.210 0.352 4.138 0.747 1.768
## 5 1798.314988 49.937 0.420 0.156 4.466 0.507 3.053 0.866 1.795
## 6 1794.244331 51.894 0.445 0.153 3.756 0.645 1.907 0.922 1.977
## 7 1790.398147 53.762 0.476 0.142 3.017 0.740 0.844 0.958 2.303
## 8 1787.563839 55.436 0.512 0.128 2.202 0.799 0.117 0.986 2.759
## 9 1785.425510 56.826 0.551 0.115 1.311 0.841 0.006 1.008 3.299
## 10 1783.781636 58.206 0.589 0.105 0.443 0.871 0.000 1.025 3.835
## 11 1783.208754 59.401 0.614 0.098 0.046 0.889 0.000 1.035 4.260
## 12 1783.062960 60.434 0.631 0.094 0.003 0.900 0.000 1.043 4.591
## 13 1782.967780 61.461 0.645 0.091 0.000 0.907 0.000 1.048 4.866
## 14 1782.883251 62.499 0.660 0.090 0.000 0.912 0.000 1.052 5.091
## 15 1782.804649 63.543 0.674 0.090 0.000 0.916 0.000 1.056 5.275
## 16 1782.730232 64.587 0.688 0.091 0.000 0.918 0.000 1.059 5.423
## 17 1782.658970 65.625 0.702 0.093 0.000 0.919 0.000 1.062 5.543
## 18 1782.590255 66.652 0.715 0.095 0.000 0.919 0.000 1.065 5.640
## 19 1782.523756 67.663 0.728 0.099 0.000 0.918 0.000 1.068 5.720
## 20 1782.459310 68.655 0.741 0.103 0.000 0.916 0.000 1.070 5.786
## 21 1782.396860 69.624 0.753 0.108 0.000 0.914 0.000 1.072 5.843
## 22 1782.336404 70.567 0.764 0.114 0.000 0.911 0.000 1.075 5.893
## 23 1782.277969 71.482 0.775 0.120 0.000 0.907 0.000 1.077 5.938
## 24 1782.221594 72.366 0.786 0.128 0.000 0.903 0.000 1.079 5.980
## 25 1782.167314 73.220 0.796 0.137 0.000 0.898 0.000 1.082 6.020
## 26 1782.115161 74.040 0.805 0.147 0.000 0.892 0.000 1.084 6.058
## 27 1782.065153 74.827 0.814 0.158 0.000 0.886 0.000 1.086 6.096
## 28 1782.017297 75.580 0.823 0.170 0.000 0.879 0.000 1.089 6.135
## 29 1781.971586 76.299 0.830 0.184 0.000 0.871 0.000 1.091 6.173
## 30 1781.928002 76.985 0.837 0.199 0.000 0.863 0.000 1.094 6.212
## 31 1781.886515 77.636 0.844 0.215 0.000 0.853 0.000 1.097 6.253
## 32 1781.847089 78.255 0.850 0.233 0.000 0.843 0.000 1.099 6.294
## 33 1781.809681 78.842 0.855 0.251 0.000 0.832 0.000 1.102 6.336
## 34 1781.774244 79.398 0.860 0.272 0.000 0.821 0.000 1.104 6.378
## 35 1781.740730 79.923 0.864 0.293 0.000 0.809 0.000 1.107 6.422
## 36 1781.709090 80.420 0.868 0.315 0.000 0.796 0.000 1.110 6.466
## 37 1781.679272 80.890 0.871 0.338 0.000 0.782 0.000 1.112 6.511
## 38 1781.651224 81.333 0.873 0.361 0.000 0.769 0.000 1.115 6.556
## 39 1781.624892 81.752 0.875 0.384 0.000 0.755 0.000 1.118 6.601
## 40 1781.600217 82.147 0.876 0.408 0.000 0.740 0.000 1.120 6.647
## 41 1781.577140 82.520 0.876 0.431 0.000 0.726 0.000 1.123 6.692
## 42 1781.555595 82.873 0.876 0.455 0.000 0.712 0.000 1.125 6.737
## 43 1781.535515 83.206 0.875 0.478 0.000 0.698 0.000 1.128 6.781
## 44 1781.516828 83.520 0.874 0.500 0.000 0.684 0.000 1.130 6.824
## 45 1781.499462 83.817 0.872 0.522 0.000 0.670 0.000 1.132 6.867
## 46 1781.483344 84.097 0.870 0.543 0.000 0.656 0.000 1.135 6.909
## 47 1781.468399 84.363 0.867 0.563 0.000 0.643 0.000 1.137 6.950
## 48 1781.454555 84.613 0.864 0.583 0.000 0.630 0.000 1.139 6.989
## 49 1781.441740 84.850 0.860 0.602 0.000 0.618 0.000 1.141 7.028
## 50 1781.429885 85.074 0.856 0.620 0.000 0.606 0.000 1.143 7.066
## 51 1781.418924 85.286 0.851 0.638 0.000 0.594 0.000 1.145 7.102
## 52 1781.408793 85.486 0.846 0.655 0.000 0.583 0.000 1.146 7.137
## 53 1781.399431 85.676 0.840 0.671 0.000 0.572 0.000 1.148 7.172
## 54 1781.390781 85.855 0.835 0.686 0.000 0.561 0.000 1.150 7.205
## 55 1781.382789 86.025 0.829 0.701 0.000 0.551 0.000 1.151 7.237
## 56 1781.375404 86.186 0.822 0.716 0.000 0.541 0.000 1.153 7.267
## 57 1781.368579 86.339 0.816 0.730 0.000 0.531 0.000 1.154 7.297
## 58 1781.362271 86.483 0.809 0.743 0.000 0.522 0.000 1.156 7.326
## 59 1781.356438 86.621 0.802 0.756 0.000 0.513 0.000 1.157 7.353
## 60 1781.351042 86.751 0.795 0.768 0.000 0.504 0.000 1.158 7.380
## 61 1781.346049 86.875 0.787 0.780 0.000 0.496 0.000 1.159 7.406
## 62 1781.341425 86.993 0.780 0.792 0.000 0.487 0.000 1.160 7.430
## 63 1781.337142 87.105 0.772 0.803 0.000 0.480 0.000 1.162 7.454
## 64 1781.333172 87.212 0.764 0.813 0.000 0.472 0.000 1.163 7.477
## 65 1781.329489 87.313 0.756 0.823 0.000 0.464 0.000 1.164 7.499
## 66 1781.326070 87.410 0.748 0.833 0.000 0.457 0.000 1.165 7.521
## 67 1781.322895 87.502 0.740 0.843 0.000 0.450 0.000 1.166 7.541
## 68 1781.319943 87.591 0.732 0.852 0.000 0.444 0.000 1.166 7.561
## 69 1781.317197 87.675 0.724 0.861 0.000 0.437 0.000 1.167 7.580
## 70 1781.314640 87.755 0.716 0.869 0.000 0.431 0.000 1.168 7.599
## 71 1781.312258 87.832 0.707 0.878 0.000 0.425 0.000 1.169 7.617
## 72 1781.310036 87.906 0.699 0.886 0.000 0.419 0.000 1.170 7.634
## 73 1781.307962 87.976 0.691 0.893 0.000 0.413 0.000 1.170 7.650
## 74 1781.306024 88.044 0.682 0.901 0.000 0.408 0.000 1.171 7.666
## 75 1781.304213 88.109 0.674 0.908 0.000 0.402 0.000 1.172 7.682
## 76 1781.302517 88.171 0.665 0.915 0.000 0.397 0.000 1.172 7.697
## 77 1781.300929 88.231 0.657 0.921 0.000 0.392 0.000 1.173 7.711
## 78 1781.299441 88.288 0.649 0.928 0.000 0.387 0.000 1.174 7.725
## 79 1781.298044 88.343 0.640 0.934 0.000 0.383 0.000 1.174 7.738
## 80 1781.296731 88.396 0.632 0.940 0.000 0.378 0.000 1.175 7.751
## 81 1781.295498 88.447 0.624 0.946 0.000 0.373 0.000 1.175 7.764
## 82 1781.294337 88.496 0.616 0.952 0.000 0.369 0.000 1.176 7.776
## 83 1781.293245 88.543 0.607 0.957 0.000 0.365 0.000 1.176 7.788
## 84 1781.292215 88.589 0.599 0.963 0.000 0.361 0.000 1.177 7.799
## 85 1781.291243 88.633 0.591 0.968 0.000 0.357 0.000 1.177 7.810
## Timings:
## SpATS 10.806 seconds
## All process 10.939 seconds
##
## Spatial analysis of trials with splines
##
## Response:                   variable
## Genotypes (as random):      germplasm
## Spatial:                    ~PSANOVA(col, row, nseg = c(nlevels(data_tmp$X), nlevels(data_tmp$Y)))
## Random:                     ~col_f + row_f
##
##
## Number of observations:        107
## Number of missing data:        104
## Effective dimension:           103.54
## Deviance:                      1781.291
##
## Dimensions:
## Effective Model Nominal Ratio Type
## Intercept 1.0 1 1 1.00 F
## germplasm 88.6 104 102 0.87 R
## col_f 0.6 54 49 0.01 R
## row_f 1.0 4 2 0.48 R
## col 1.0 1 1 1.00 S
## row 1.0 1 1 1.00 S
## rowcol 1.0 1 1 1.00 S
## f(col) 0.0 55 55 0.00 S
## f(row) 0.4 5 5 0.07 S
## f(col):row 0.0 55 55 0.00 S
## col:f(row) 1.2 5 5 0.24 S
## f(col):f(row) 7.8 275 275 0.03 S
##
## Total 103.5 561 552 0.19
## Residual 3.5
## Nobs 107
##
## Type codes: F 'Fixed' R 'Random' S 'Smooth/Semiparametric'
##
##
## Spatial analysis of trials with splines
##
## Response:                   variable
## Genotypes (as random):      germplasm
## Spatial:                    ~PSANOVA(col, row, nseg = c(nlevels(data_tmp$X), nlevels(data_tmp$Y)))
## Random:                     ~col_f + row_f
##
##
## Number of observations:        107
## Number of missing data:        104
## Effective dimension:           103.54
## Deviance:                      1781.291
##
## Dimensions:
##                   Effective     Model     Nominal     Ratio     Type
## Intercept               1.0         1           1      1.00        F
## germplasm              88.6       104         102      0.87        R
## col_f                   0.6        54          49      0.01        R
## row_f                   1.0         4           2      0.48        R
## col                     1.0         1           1      1.00        S
## row                     1.0         1           1      1.00        S
## rowcol                  1.0         1           1      1.00        S
## f(col)                  0.0        55          55      0.00        S
## f(row)                  0.4         5           5      0.07        S
## f(col):row              0.0        55          55      0.00        S
## col:f(row)              1.2         5           5      0.24        S
## f(col):f(row)           7.8       275         275      0.03        S
##
## Total                 103.5       561         552      0.19
## Residual                3.5
## Nobs                    107
##
## Type codes: F 'Fixed' R 'Random' S 'Smooth/Semiparametric'out_spatial is a list containing two elements :
info: a list with variable and data
out_spatial$info$variable## [1] "y1"head(out_spatial$info$data)## seed_lot location year germplasm block X Y y1 y2
## 1 germ-1_loc-1_2018_0001 loc-1 2018 germ-1 1 1 1 18132.88 18
## 2 germ-2_loc-1_2018_0001 loc-1 2018 germ-2 1 2 1 19910.61 20
## 3 germ-3_loc-1_2018_0001 loc-1 2018 germ-3 1 3 1 19575.27 25
## 4 germ-4_loc-1_2018_0001 loc-1 2018 germ-4 1 4 1 19098.78 22
## 5 germ-29_loc-1_2018_0001 loc-1 2018 germ-29 1 5 1 NA NA
## 6 germ-30_loc-1_2018_0001 loc-1 2018 germ-30 1 6 1 NA NA
## y3
## 1 312
## 2 275
## 3 267
## 4 256
## 5 NA
## 6 NAmodela list with four elements :model
out_spatial$model$model## ## Spatial analysis of trials with splines ## ## Response: variable ## Genotypes (as random): germplasm ## Spatial: ~PSANOVA(col, row, nseg = c(nlevels(data_tmp$X), nlevels(data_tmp$Y))) ## Random: ~col_f + row_f ## ## ## Number of observations: 107 ## Number of missing data: 104 ## Effective dimension: 103.54 ## Deviance: 1781.291summary
out_spatial$model$summary## ## Spatial analysis of trials with splines ## ## Response: variable ## Genotypes (as random): germplasm ## Spatial: ~PSANOVA(col, row, nseg = c(nlevels(data_tmp$X), nlevels(data_tmp$Y))) ## Random: ~col_f + row_f ## ## ## Number of observations: 107 ## Number of missing data: 104 ## Effective dimension: 103.54 ## Deviance: 1781.291 ## ## Dimensions: ## Effective Model Nominal Ratio Type ## Intercept 1.0 1 1 1.00 F ## germplasm 88.6 104 102 0.87 R ## col_f 0.6 54 49 0.01 R ## row_f 1.0 4 2 0.48 R ## col 1.0 1 1 1.00 S ## row 1.0 1 1 1.00 S ## rowcol 1.0 1 1 1.00 S ## f(col) 0.0 55 55 0.00 S ## f(row) 0.4 5 5 0.07 S ## f(col):row 0.0 55 55 0.00 S ## col:f(row) 1.2 5 5 0.24 S ## f(col):f(row) 7.8 275 275 0.03 S ## ## Total 103.5 561 552 0.19 ## Residual 3.5 ## Nobs 107 ## ## Type codes: F 'Fixed' R 'Random' S 'Smooth/Semiparametric'var_resthe variance of the residuals
out_spatial$model$df_residual## [1] 3.5out_spatial$model$MSerror## [1] 508.9404
3.5.4.5 Check and visualize model outputs
The tests to check the model are explained in section 3.1.2.1.2.
3.5.4.5.1 Check the model
out_check_spatial = check_model(out_spatial)out_check_spatial is a list containing two elements :
spatialthe output from the modeldata_ggplota list containing information for ggplot:data_ggplot_residualsa list containing :data_ggplot_normalitydata_ggplot_skewness_testdata_ggplot_kurtosis_testdata_ggplot_shapiro_testdata_ggplot_qqplot
data_ggplot_variability_repartition_pie
3.5.4.5.2 Visualize outputs
Once the computation is done, you can visualize the results with plot
p_out_check_spatial = plot(out_check_spatial)p_out_check_spatial is a list with:
residualshistogram: histogram with the distribution of the residuals
p_out_check_spatial$residuals$histogram## `stat_bin()` using `bins = 30`. Pick better value with `binwidth`.
qqplot
p_out_check_spatial$residuals$qqplot
points
p_out_check_spatial$residuals$points
variability_repartition: pie with repartition of variance for each factor
p_out_check_spatial$variability_repartition
3.5.4.6 Get and visualize mean comparisons
The method to compute mean comparison are explained in section 3.1.2.1.3.
3.5.4.7 Get mean comparisons
Get mean comparisons with mean_comparisons.
out_mean_comparisons_spatial = mean_comparisons(out_check_spatial, p.adj = "bonferroni")out_mean_comparisons_spatial is a list of two elements:
info: a list with variable and datadata_ggplot_LSDbarplot_germplasm
3.5.4.8 Visualize mean comparisons
p_out_mean_comparisons_spatial = plot(out_mean_comparisons_spatial)p_out_mean_comparisons_spatial is a list of two elements
germplasm_blupwhih represent the BLUPs with their confidence intervalle
p_out_mean_comparisons_spatial$germplasm_blup
germplasm_barplot. For each element of the list, there are as many graph as needed withnb_parameters_per_plotparameters per graph. Letters are displayed on each bar. Parameters that do not share the same letters are different regarding type I error (alpha) and alpha correction. The error I (alpha) and the alpha correction are displayed in the title.
pg = p_out_mean_comparisons_spatial$germplasm_barplot
pg$`23`
## NULL3.5.4.9 Get and vizualise groups of parameters
3.5.4.9.1 Get groups of parameters
In order to cluster locations or germplasms, you may use mulivariate analysis on a matrix with several variables in columns and parameter in rows.
This is done with parameter_groups() which do a PCA on this matrix.
Clusters are done based on HCPC method as explained here
Lets’ have an example with three variables.
First run the models
out_spatial_2 = model_spatial(data_model_spatial, variable = "y2")## Effective dimensions
## -------------------------
## It. Deviance germplasm col_f row_f f(col) f(row) f(col):row col:f(row)f(col):f(row)
## 1 752.878073 41.911 0.387 0.210 9.825 0.150 7.982 0.141 2.912
## 2 419.535807 43.966 0.522 0.089 7.493 0.098 5.947 0.417 2.641
## 3 410.398567 45.608 0.694 0.040 5.722 0.066 4.341 0.843 2.355
## 4 404.258754 47.135 0.902 0.018 4.512 0.047 2.945 1.101 2.175
## 5 400.833985 48.557 1.137 0.009 3.686 0.033 1.963 1.168 2.059
## 6 398.742890 49.897 1.401 0.005 3.037 0.025 1.348 1.183 1.957
## 7 397.045030 51.238 1.700 0.003 2.449 0.019 0.873 1.189 1.861
## 8 395.573882 52.604 2.041 0.002 1.898 0.015 0.436 1.193 1.761
## 9 394.530274 53.904 2.428 0.001 1.424 0.012 0.139 1.193 1.638
## 10 393.941514 55.056 2.856 0.001 1.070 0.010 0.032 1.191 1.490
## 11 393.627428 56.073 3.319 0.000 0.841 0.009 0.006 1.189 1.337
## 12 393.432742 56.975 3.809 0.000 0.708 0.008 0.001 1.188 1.193
## 13 393.282401 57.783 4.326 0.000 0.632 0.007 0.000 1.187 1.068
## 14 393.150564 58.512 4.865 0.000 0.587 0.006 0.000 1.187 0.961
## 15 393.029292 59.171 5.423 0.000 0.562 0.006 0.000 1.188 0.871
## 16 392.916391 59.771 5.995 0.000 0.547 0.005 0.000 1.188 0.795
## 17 392.811570 60.316 6.572 0.000 0.539 0.004 0.000 1.189 0.731
## 18 392.715148 60.813 7.148 0.000 0.536 0.004 0.000 1.191 0.678
## 19 392.627537 61.268 7.715 0.000 0.535 0.003 0.000 1.192 0.633
## 20 392.549019 61.686 8.265 0.000 0.536 0.003 0.000 1.193 0.596
## 21 392.479639 62.072 8.792 0.000 0.537 0.003 0.000 1.195 0.565
## 22 392.419185 62.431 9.290 0.000 0.540 0.002 0.000 1.196 0.540
## 23 392.367204 62.768 9.756 0.000 0.542 0.002 0.000 1.197 0.520
## 24 392.323049 63.084 10.186 0.000 0.545 0.002 0.000 1.198 0.504
## 25 392.285947 63.384 10.578 0.000 0.548 0.001 0.000 1.200 0.491
## 26 392.255057 63.669 10.933 0.000 0.550 0.001 0.000 1.201 0.482
## 27 392.229526 63.941 11.250 0.000 0.553 0.001 0.000 1.202 0.475
## 28 392.208541 64.201 11.532 0.000 0.555 0.001 0.000 1.203 0.471
## 29 392.191351 64.450 11.779 0.000 0.557 0.001 0.000 1.204 0.469
## 30 392.177291 64.689 11.996 0.000 0.559 0.000 0.000 1.205 0.469
## 31 392.165782 64.918 12.184 0.000 0.560 0.000 0.000 1.206 0.471
## 32 392.156339 65.137 12.346 0.000 0.562 0.000 0.000 1.207 0.474
## 33 392.148555 65.347 12.485 0.000 0.563 0.000 0.000 1.207 0.479
## 34 392.142101 65.547 12.604 0.000 0.564 0.000 0.000 1.208 0.486
## 35 392.136708 65.738 12.705 0.000 0.565 0.000 0.000 1.209 0.494
## 36 392.132161 65.919 12.790 0.000 0.566 0.000 0.000 1.209 0.503
## 37 392.128290 66.091 12.861 0.000 0.567 0.000 0.000 1.210 0.513
## 38 392.124956 66.254 12.921 0.000 0.568 0.000 0.000 1.210 0.524
## 39 392.122055 66.408 12.971 0.000 0.569 0.000 0.000 1.211 0.536
## 40 392.119499 66.554 13.013 0.000 0.570 0.000 0.000 1.211 0.549
## 41 392.117222 66.691 13.047 0.000 0.570 0.000 0.000 1.212 0.564
## 42 392.115170 66.821 13.076 0.000 0.571 0.000 0.000 1.212 0.579
## 43 392.113302 66.943 13.099 0.000 0.571 0.000 0.000 1.213 0.594
## 44 392.111583 67.058 13.119 0.000 0.572 0.000 0.000 1.213 0.611
## 45 392.109986 67.166 13.134 0.000 0.572 0.000 0.000 1.213 0.628
## 46 392.108492 67.268 13.147 0.000 0.573 0.000 0.000 1.214 0.646
## 47 392.107082 67.363 13.158 0.000 0.573 0.000 0.000 1.214 0.665
## 48 392.105743 67.453 13.167 0.000 0.574 0.000 0.000 1.214 0.684
## 49 392.104465 67.537 13.174 0.000 0.574 0.000 0.000 1.215 0.704
## 50 392.103239 67.617 13.180 0.000 0.574 0.000 0.000 1.215 0.725
## 51 392.102059 67.691 13.185 0.000 0.575 0.000 0.000 1.215 0.746
## 52 392.100918 67.761 13.189 0.000 0.575 0.000 0.000 1.216 0.767
## 53 392.099814 67.828 13.193 0.000 0.575 0.000 0.000 1.216 0.789
## 54 392.098743 67.890 13.197 0.000 0.576 0.000 0.000 1.216 0.811
## 55 392.097702 67.949 13.200 0.000 0.576 0.000 0.000 1.216 0.834
## 56 392.096690 68.005 13.203 0.000 0.576 0.000 0.000 1.217 0.857
## 57 392.095706 68.057 13.206 0.000 0.576 0.000 0.000 1.217 0.880
## Timings:
## SpATS 7.208 seconds
## All process 7.629 seconds
##
## Spatial analysis of trials with splines
##
## Response: variable
## Genotypes (as random): germplasm
## Spatial: ~PSANOVA(col, row, nseg = c(nlevels(data_tmp$X), nlevels(data_tmp$Y)))
## Random: ~col_f + row_f
##
##
## Number of observations: 112
## Number of missing data: 99
## Effective dimension: 87.94
## Deviance: 392.096
##
## Dimensions:
## Effective Model Nominal Ratio Type
## Intercept 1.0 1 1 1.00 F
## germplasm 68.1 107 106 0.64 R
## col_f 13.2 54 50 0.26 R
## row_f 0.0 4 2 0.00 R
## col 1.0 1 1 1.00 S
## row 1.0 1 1 1.00 S
## rowcol 1.0 1 1 1.00 S
## f(col) 0.6 55 55 0.01 S
## f(row) 0.0 5 5 0.00 S
## f(col):row 0.0 55 55 0.00 S
## col:f(row) 1.2 5 5 0.24 S
## f(col):f(row) 0.9 275 275 0.00 S
##
## Total 87.9 564 557 0.16
## Residual 24.1
## Nobs 112
##
## Type codes: F 'Fixed' R 'Random' S 'Smooth/Semiparametric'
##
##
## Spatial analysis of trials with splines
##
## Response: variable
## Genotypes (as random): germplasm
## Spatial: ~PSANOVA(col, row, nseg = c(nlevels(data_tmp$X), nlevels(data_tmp$Y)))
## Random: ~col_f + row_f
##
##
## Number of observations: 112
## Number of missing data: 99
## Effective dimension: 87.94
## Deviance: 392.096
##
## Dimensions:
## Effective Model Nominal Ratio Type
## Intercept 1.0 1 1 1.00 F
## germplasm 68.1 107 106 0.64 R
## col_f 13.2 54 50 0.26 R
## row_f 0.0 4 2 0.00 R
## col 1.0 1 1 1.00 S
## row 1.0 1 1 1.00 S
## rowcol 1.0 1 1 1.00 S
## f(col) 0.6 55 55 0.01 S
## f(row) 0.0 5 5 0.00 S
## f(col):row 0.0 55 55 0.00 S
## col:f(row) 1.2 5 5 0.24 S
## f(col):f(row) 0.9 275 275 0.00 S
##
## Total 87.9 564 557 0.16
## Residual 24.1
## Nobs 112
##
## Type codes: F 'Fixed' R 'Random' S 'Smooth/Semiparametric'out_spatial_3 = model_spatial(data_model_spatial, variable = "y3")## Effective dimensions
## -------------------------
## It. Deviance germplasm col_f row_f f(col) f(row) f(col):row col:f(row)f(col):f(row)
## 1 76730.878077 42.736 0.414 0.218 10.013 0.155 8.064 0.152 3.158
## 2 978.299650 46.606 0.537 0.097 6.537 0.055 5.770 0.147 3.335
## 3 968.603398 49.218 0.656 0.061 4.472 0.031 4.096 0.098 3.435
## 4 961.162214 50.901 0.783 0.043 2.965 0.020 2.695 0.052 3.634
## 5 956.556509 51.807 0.923 0.030 1.702 0.012 1.766 0.025 3.886
## 6 954.992653 51.910 1.068 0.019 0.935 0.007 1.501 0.012 4.046
## 7 954.339333 51.676 1.222 0.012 0.438 0.005 1.449 0.006 4.120
## 8 954.067806 51.310 1.385 0.008 0.166 0.003 1.441 0.003 4.105
## 9 953.955444 50.888 1.555 0.005 0.058 0.002 1.441 0.001 4.035
## 10 953.897175 50.455 1.734 0.003 0.019 0.001 1.440 0.001 3.952
## 11 953.858105 50.029 1.923 0.002 0.006 0.001 1.439 0.000 3.874
## 12 953.826496 49.616 2.121 0.001 0.002 0.001 1.438 0.000 3.806
## 13 953.798326 49.217 2.327 0.001 0.001 0.000 1.436 0.000 3.747
## 14 953.772271 48.835 2.539 0.001 0.000 0.000 1.435 0.000 3.697
## 15 953.747949 48.468 2.757 0.000 0.000 0.000 1.433 0.000 3.654
## 16 953.725304 48.117 2.977 0.000 0.000 0.000 1.432 0.000 3.619
## 17 953.704376 47.783 3.198 0.000 0.000 0.000 1.431 0.000 3.589
## 18 953.685218 47.464 3.418 0.000 0.000 0.000 1.430 0.000 3.564
## 19 953.667866 47.161 3.635 0.000 0.000 0.000 1.429 0.000 3.544
## 20 953.652322 46.875 3.846 0.000 0.000 0.000 1.428 0.000 3.527
## 21 953.638552 46.604 4.051 0.000 0.000 0.000 1.428 0.000 3.514
## 22 953.626486 46.349 4.246 0.000 0.000 0.000 1.427 0.000 3.504
## 23 953.616026 46.109 4.433 0.000 0.000 0.000 1.426 0.000 3.496
## 24 953.607049 45.883 4.608 0.000 0.000 0.000 1.426 0.000 3.491
## 25 953.599418 45.672 4.772 0.000 0.000 0.000 1.425 0.000 3.487
## 26 953.592988 45.475 4.925 0.000 0.000 0.000 1.425 0.000 3.485
## 27 953.587613 45.291 5.066 0.000 0.000 0.000 1.424 0.000 3.485
## 28 953.583151 45.119 5.195 0.000 0.000 0.000 1.424 0.000 3.485
## 29 953.579470 44.959 5.313 0.000 0.000 0.000 1.423 0.000 3.487
## 30 953.576449 44.809 5.420 0.000 0.000 0.000 1.423 0.000 3.489
## 31 953.573979 44.670 5.517 0.000 0.000 0.000 1.423 0.000 3.492
## 32 953.571966 44.539 5.604 0.000 0.000 0.000 1.422 0.000 3.495
## 33 953.570328 44.418 5.682 0.000 0.000 0.000 1.422 0.000 3.499
## 34 953.568996 44.304 5.751 0.000 0.000 0.000 1.422 0.000 3.503
## 35 953.567913 44.197 5.813 0.000 0.000 0.000 1.421 0.000 3.507
## 36 953.567030 44.098 5.868 0.000 0.000 0.000 1.421 0.000 3.512
## Timings:
## SpATS 4.532 seconds
## All process 4.622 seconds
##
## Spatial analysis of trials with splines
##
## Response: variable
## Genotypes (as random): germplasm
## Spatial: ~PSANOVA(col, row, nseg = c(nlevels(data_tmp$X), nlevels(data_tmp$Y)))
## Random: ~col_f + row_f
##
##
## Number of observations: 118
## Number of missing data: 93
## Effective dimension: 58.90
## Deviance: 953.567
##
## Dimensions:
## Effective Model Nominal Ratio Type
## Intercept 1.0 1 1 1.00 F
## germplasm 44.1 108 107 0.41 R
## col_f 5.9 54 50 0.12 R
## row_f 0.0 4 2 0.00 R
## col 1.0 1 1 1.00 S
## row 1.0 1 1 1.00 S
## rowcol 1.0 1 1 1.00 S
## f(col) 0.0 55 55 0.00 S
## f(row) 0.0 5 5 0.00 S
## f(col):row 1.4 55 55 0.03 S
## col:f(row) 0.0 5 5 0.00 S
## f(col):f(row) 3.5 275 275 0.01 S
##
## Total 58.9 565 558 0.11
## Residual 59.1
## Nobs 118
##
## Type codes: F 'Fixed' R 'Random' S 'Smooth/Semiparametric'
##
##
## Spatial analysis of trials with splines
##
## Response: variable
## Genotypes (as random): germplasm
## Spatial: ~PSANOVA(col, row, nseg = c(nlevels(data_tmp$X), nlevels(data_tmp$Y)))
## Random: ~col_f + row_f
##
##
## Number of observations: 118
## Number of missing data: 93
## Effective dimension: 58.90
## Deviance: 953.567
##
## Dimensions:
## Effective Model Nominal Ratio Type
## Intercept 1.0 1 1 1.00 F
## germplasm 44.1 108 107 0.41 R
## col_f 5.9 54 50 0.12 R
## row_f 0.0 4 2 0.00 R
## col 1.0 1 1 1.00 S
## row 1.0 1 1 1.00 S
## rowcol 1.0 1 1 1.00 S
## f(col) 0.0 55 55 0.00 S
## f(row) 0.0 5 5 0.00 S
## f(col):row 1.4 55 55 0.03 S
## col:f(row) 0.0 5 5 0.00 S
## f(col):f(row) 3.5 275 275 0.01 S
##
## Total 58.9 565 558 0.11
## Residual 59.1
## Nobs 118
##
## Type codes: F 'Fixed' R 'Random' S 'Smooth/Semiparametric'Then check the models
out_check_spatial_2 = check_model(out_spatial_2)
out_check_spatial_3 = check_model(out_spatial_3)
Then run the function for germplasm.
list_out_check_model = list("spatial_1" = out_check_spatial, "spatial_2" = out_check_spatial_2, "spatial_3" = out_check_spatial_3)
out_parameter_groups = parameter_groups(list_out_check_model, "germplasm")
## Warning in FactoMineR::PCA(mat, scale.unit = TRUE, ncp = 2, graph = FALSE):
## Missing values are imputed by the mean of the variable: you should use the
## imputePCA function of the missMDA packageout_parameter_groups is list of two elements:
obj.pca: the PCA object fromFactoMineR::PCA()clust, a list of two elements:res.hcpc: the HCPC object fromFactoMineR::HCPC()clust: the dataframe with cluster assigned to each individual
3.5.4.9.2 Visualize groups of parameters
Visualize outputs with plot
p_germplasm_group = plot(out_parameter_groups)p_germplasm_group is list of two elements :
pca: a list with three elements on the PCA on the group of parameters :composante_variance: variance caught by each dimension of the PCA
p_germplasm_group$pca$composante_variance
ind: graph of individuals
p_germplasm_group$pca$ind
var: graph of variables
p_germplasm_group$pca$var
clust: output fromfactextra::fviz_cluster(), a list of number of cluster + 1 element
cl = p_germplasm_group$clust
names(cl)
## [1] "cluster_all" "cluster_1" "cluster_2"cl$cluster_all
cl$cluster_1## Warning: Removed 2 rows containing non-finite values (stat_mean).## Warning: Removed 2 rows containing missing values (geom_point).## Warning: Removed 2 rows containing missing values (geom_text_repel).
3.5.4.10 post hoc analysis to visualize variation repartition for several variables
list_out_check_model = list("spatial_1" = out_check_spatial, "spatial_2" = out_check_spatial_2, "spatial_3" = out_check_spatial_3)
post_hoc_variation(list_out_check_model)
3.5.4.11 Apply the workflow to several variables
If you wish to apply the spatial workflow to several variables, you can use lapply with the following code :
workflow_spatial = function(x, data){
  out_spatial = model_spatial(data = data, variable = x)

  out_check_spatial = check_model(out_spatial)
  p_out_check_spatial = plot(out_check_spatial)

  out_mean_comparisons_spatial = mean_comparisons(out_check_spatial, p.adj = "bonferroni")
  p_out_mean_comparisons_spatial = plot(out_mean_comparisons_spatial)

  out = list(
    out_spatial = out_spatial,
    out_check_spatial = out_check_spatial,
    p_out_check_spatial = p_out_check_spatial,
    out_mean_comparisons_spatial = out_mean_comparisons_spatial,
    p_out_mean_comparisons_spatial = p_out_mean_comparisons_spatial
    )
  return(out)
}

vec_variables = c("y1", "y1", "y1")
out = lapply(vec_variables, workflow_spatial, data_model_spatial)
names(out) = vec_variables


list_out_check_model = list("spatial_1" = out_check_spatial, "spatial_2" = out_check_spatial_2, "spatial_3" = out_check_spatial_3)

out_parameter_groups = parameter_groups(list_out_check_model, "germplasm" )
p_germplasm_group = plot(out_parameter_groups)

p_post_hoc_variation = post_hoc_variation(list_out_check_model)
3.5.5 Mixted model for incomplete block design (M5)
!!! TO DO !!!
The model is based on frequentist statistics (section 3.1.2.1). The tests to check the model are explained in section 3.1.2.1.2. The method to compute mean comparison are explained in section 3.1.2.1.3.
(Zystro, Colley, and Dawson 2018)
#library(ibd)
#data(ibddata)
#aov.ibd(y~factor(trt)+factor(blk),data=ibddata)
#contrast=matrix(c(1,-1,0,0,0,0,0,0,0,0,0,1,-1,0,0,0,0,0),nrow=2,byrow=TRUE)
#aov.ibd(y~factor(trt)+factor(blk),specs="trt",data=ibddata,contrast=contrast)
3.5.6 Hierarchical Bayesian intra-location model to perform mean comparisons with each farm (M7a)
At the farm level, the residual has few degrees of freedom, leading to a poor estimation of the residual variance and to a lack of power for comparing populations. model_bh_intra_location was implemented to improve efficiency of mean comparisons. It is efficient with more than 20 environment (i.e. location \(\times\) year) (Rivière et al. 2015). The model is based on bayesian statistics (section 3.1.2.2).
3.5.6.1 Theory of the model
The experimental design used is satellite and regional farms (D4). The model is described in Rivière et al. (2015). We restricted ourselves to analysing values at the plot level (the values may result from the average of individual plants measures). The phenotypic value \(Y_{ijk}\) for variable \(Y\), germplasm \(i\), environment \(j\) and block \(k\) is modelled as :
\(Y_{ijk} = \mu_{ij} + \beta_{jk} + \varepsilon_{ijk} ; \quad \varepsilon_{ijk} \sim \mathcal{N} (0,\sigma^2_{j})\),
where
- \(\mu_{ij}\) is the mean of germplasm \(i\) in environment \(j\) (note that this parameter, which corresponds to an entry, confounds the population effect and the population \(\times\) environment effect);
- \(\beta_{jk}\) is the effect of block \(k\) in environment \(j\) satisfying the constraint8 \(\sum\limits_{k=1}^K \beta_{jk} = 1\) ;
- \(\varepsilon_{ijk}\) is the residual error;
- \(\mathcal{N} (0,\sigma^2_{j})\) denotes normal distribution centred on 0 with variance \(\sigma^2_{j}\), which is specific to environment \(j\).
We take advantage of the similar structure of the trials in each environment of the network to assume that trial residual variances come from a common distribution :
\(\sigma^2_{j} \sim \frac{1}{Gamma(\nu,\rho)}\),
where \(\nu\) and \(\rho\) are unknown parameters. Because of the low number of residual degrees of freedom for each farm, we use a hierarchical approach in order to assess mean differences on farm. For that, we place vague prior distributions on the hyperparameters \(\nu\) and \(\rho\) :
\(\nu \sim Uniform(\nu_{min},\nu_{max}) ; \quad \rho \sim Gamma(10^{-6},10^{-6})\).
In other words, the residual variance of a trial in a given environment is estimated using all the informations available on the network rather than using the data from that particular trial only.
The parameters \(\mu_{ij}\) and \(\beta_{jk}\) are assumed to follow vague prior distributions too:
\(\mu_{ij} \sim \mathcal{N}(\mu_{.j},10^{6}); \quad \beta_{jk} \sim \mathcal{N}(0,10^{6})\).
The inverse gamma distribution has a minimum value of 0 (consistent with the definition of a variance) and may have various shapes including asymmetric distributions. From an agronomical point of view, the assumption that trial variances are heterogeneous is consistent with organic farming: there are as many environments as farms and farmers leading to a high heterogeneity. Environment is here considered in a broad sense: practices (sowing date, sowing density, tilling, etc.), pedo climatic conditions, biotic and abiotic stress, … (Desclaux et al. 2008). Moreover, the inverse gamma distribution has conjugate properties that facilitate MCMC convergence. This model is therefore a good choice based on both agronomic and statistical criteria.
The residual variance estimated from the controls is assumed to be representative of the residual variance of the other entries. Blocks are included in the model only if the trial has blocks.
3.5.6.2 Steps with
To run model_bh_intra_location, follow these steps (Figure 3.2):
- Format the data with
format_data_PPBstats() - Run the model with
model_bh_intra_location() - Check model outputs with graphs using
check_model()to know if you can continue the analysis - Get mean comparisons for each factor with
mean_comparisons()and vizualise it withplot()
3.5.6.3 Format the data
The values for \(\mu_{ij}\), \(\beta_{jk}\), \(\epsilon_{ijk}\) and \(\sigma_j\) are the real value used to create the simulated dataset. This dataset is representative of data obtain in a PPB programme.
data(data_model_bh_intra_location)
data_model_bh_intra_location = format_data_PPBstats(data_model_bh_intra_location, type = "data_agro")
## Warning in format_data_PPBstats.data_agro(data): Column "long" is needed to
## get map and not present in data.## Warning in format_data_PPBstats.data_agro(data): Column "lat" is needed to
## get map and not present in data.## data has been formated for PPBstats functions.head(data_model_bh_intra_location) # first rows of the data## seed_lot location year germplasm block X Y tkw
## 1 germ-25_loc-1_2005_0001 loc-1 2005 germ-25 1 1 a 72.09900
## 2 germ-26_loc-1_2005_0001 loc-1 2005 germ-26 1 2 b 61.05274
## 3 germ-27_loc-1_2005_0001 loc-1 2005 germ-27 1 3 c 62.99350
## 4 germ-28_loc-1_2005_0001 loc-1 2005 germ-28 1 4 d 65.10909
## 5 germ-25_loc-1_2005_0001 loc-1 2005 germ-25 2 5 e 77.01361
## 6 germ-26_loc-1_2005_0001 loc-1 2005 germ-26 2 6 f 64.10541
## tkw$date mu_ij beta_jk epsilon_ijk sigma_j tkw$date_julian
## 1 2017-07-22 73.37224 0 -1.2732421 1.622339 202
## 2 2017-07-22 61.61823 0 -0.5654918 1.622339 202
## 3 2017-07-22 64.31830 0 -1.3248006 1.622339 202
## 4 2017-07-22 62.57840 0 2.5306946 1.622339 202
## 5 2017-07-22 73.37224 0 3.6413666 1.622339 202
## 6 2017-07-22 61.61823 0 2.4871807 1.622339 2023.5.6.4 Run the model
To run model model_bh_intra_location on the dataset, used the function model_bh_intra_location().
Here it is run on thousand kernel weight (tkw).
By default, model_bh_intra_location returns posteriors for
\(\mu_{ij}\) (return.mu = TRUE),
\(\beta_{jk}\) (return.beta = TRUE),
\(\sigma_j\) (return.sigma = TRUE),
\(\nu\) (return.nu = TRUE) and
\(\rho\) (return.rho = TRUE).
You can also get \(\epsilon_{ijk}\) value with return.espilon = TRUE.
DIC criterion is a generalization of the AIC criterion that can be used for hierarchical models (Spiegelhalter et al. 2002).
The smaller the DIC value, the better the model (Plummer 2008).
By default, DIC is not displayed, you can ask for this value to compare to other model (DIC = TRUE).
# out_model_bh_intra_location = model_bh_intra_location(data = data_model_bh_intra_location, variable = "tkw", return.epsilon = TRUE)

# Compiling model graph
# Resolving undeclared variables
# Allocating nodes
# Graph information:
#   Observed stochastic nodes: 976
# Unobserved stochastic nodes: 927
# Total graph size: 8609
#
# Initializing model
#
# |++++++++++++++++++++++++++++++++++++++++++++++++++| 100%
# |**************************************************| 100%
# |**************************************************| 100%
# |**************************************************| 100%

load("./data_PPBstats/out_model_bh_intra_location.RData") # To save time
You can get information on the environments in the dataset :
out_model_bh_intra_location$vec_env_with_no_data## NULLout_model_bh_intra_location$vec_env_with_no_controls## [1] "loc-25:2005"out_model_bh_intra_location$vec_env_with_controls## [1] "loc-10:2005" "loc-10:2006" "loc-10:2007" "loc-11:2005" "loc-11:2006"
## [6] "loc-11:2007" "loc-1:2005" "loc-1:2006" "loc-1:2007" "loc-12:2005"
## [11] "loc-12:2006" "loc-12:2007" "loc-13:2005" "loc-13:2006" "loc-13:2007"
## [16] "loc-14:2005" "loc-14:2006" "loc-14:2007" "loc-15:2005" "loc-15:2006"
## [21] "loc-15:2007" "loc-16:2005" "loc-16:2006" "loc-16:2007" "loc-17:2005"
## [26] "loc-17:2006" "loc-17:2007" "loc-18:2005" "loc-18:2006" "loc-18:2007"
## [31] "loc-19:2006" "loc-19:2007" "loc-20:2006" "loc-20:2007" "loc-21:2006"
## [36] "loc-21:2007" "loc-2:2005" "loc-2:2006" "loc-2:2007" "loc-22:2006"
## [41] "loc-22:2007" "loc-23:2006" "loc-23:2007" "loc-3:2005" "loc-3:2006"
## [46] "loc-3:2007" "loc-4:2005" "loc-4:2006" "loc-4:2007" "loc-5:2006"
## [51] "loc-6:2006" "loc-6:2007" "loc-7:2006" "loc-7:2007" "loc-8:2006"
## [56] "loc-9:2005" "loc-9:2006" "loc-9:2007"out_model_bh_intra_location$vec_env_RF## [1] "loc-1:2005" "loc-1:2006" "loc-1:2007" "loc-2:2005" "loc-2:2006"
## [6] "loc-2:2007" "loc-3:2005" "loc-3:2006" "loc-3:2007" "loc-4:2005"
## [11] "loc-4:2006" "loc-4:2007" "loc-5:2006" "loc-6:2006" "loc-6:2007"
## [16] "loc-7:2006" "loc-7:2007" "loc-8:2006"out_model_bh_intra_location$vec_env_SF## [1] "loc-10:2005" "loc-10:2006" "loc-10:2007" "loc-11:2005" "loc-11:2006"
## [6] "loc-11:2007" "loc-12:2005" "loc-12:2006" "loc-12:2007" "loc-13:2005"
## [11] "loc-13:2006" "loc-13:2007" "loc-14:2005" "loc-14:2006" "loc-14:2007"
## [16] "loc-15:2005" "loc-15:2006" "loc-15:2007" "loc-16:2005" "loc-16:2006"
## [21] "loc-16:2007" "loc-17:2005" "loc-17:2006" "loc-17:2007" "loc-18:2005"
## [26] "loc-18:2006" "loc-18:2007" "loc-19:2006" "loc-19:2007" "loc-20:2006"
## [31] "loc-20:2007" "loc-21:2006" "loc-21:2007" "loc-22:2006" "loc-22:2007"
## [36] "loc-23:2006" "loc-23:2007" "loc-9:2005" "loc-9:2006" "loc-9:2007"Below is an example with low nb_iterations (see section 3.1.2.2 about the number of iterations):
# out_model_bh_intra_location_bis = model_bh_intra_location(data = data_model_bh_intra_location, variable = "tkw", nb_iteration = 5000)

# Compiling model graph
# Resolving undeclared variables
# Allocating nodes
# Graph information:
#   Observed stochastic nodes: 976
# Unobserved stochastic nodes: 927
# Total graph size: 8609
#
# Initializing model
#
# |++++++++++++++++++++++++++++++++++++++++++++++++++| 100%
# |**************************************************| 100%
# |**************************************************| 100%
# Warning message:
#   In model_bh_intra_location(data = data_model_bh_intra_location, variable = "tkw", nb_iteration = 5000) :
#   nb_iterations is below 20 000, which seems small to get convergence in the MCMC.

load("./data_PPBstats/out_model_bh_intra_location_bis.RData") # To save time
3.5.6.5 Check and visualize model outputs
The tests to check the model are explained in section 3.1.2.2.2.
3.5.6.5.1 Check the model
Once the model has been run, it is necessary to check if the outputs can be taken with confidence.
This step is needed before going ahead in the analysis (in fact the object used in the next functions must come from check_model).
# out_check_model_bh_intra_location = check_model(out_model_bh_intra_location)

# The Gelman-Rubin test is running for each parameter ...
# The two MCMC for each parameter converge thanks to the Gelman-Rubin test.

load("./data_PPBstats/out_check_model_bh_intra_location.RData") # To save time
out_check_model_bh_intra_location is a list containing:
MCMC: a data fame resulting from the concatenation of the two MCMC for each parameter. This object can be used for further analysis. There are as many columns as parameters and as many rows asiterations/thin(thethinvalue is 10 by default in the models).
dim(out_check_model_bh_intra_location$MCMC)## [1] 20000 945MCMC_conv_not_ok: a data fame resulting from the concatenation of the two MCMC for each parameter for environments where some parameters did not converge for mu and betadata_env_with_no_controls: data frame with environnements without controlsdata_env_whose_param_did_not_converge: a list with data frame with environments where some parameters did not converge for mu and betadata_ggplot: a list containing information for ggplot:sigma_jmu_ijbeta_jksigma_j_2epsilon_ijk
When considering out_model_bh_intra_location_bis:
# out_check_model_bh_intra_location_bis = check_model(out_model_bh_intra_location_bis)

# The Gelman-Rubin test is running for each parameter ...
# The two MCMC of the following parameters do not converge thanks to the Gelman-Rubin test : # mu[germ-20,loc-15:2006], nu, rho, sigma[loc-15:2006]. Therefore, they are not present in MCMC output.
# MCMC are updated, the following environment were deleted : loc-15:2006
# data_env_whose_param_did_not_converge contains the raw data for these environments.

load("./data_PPBstats/out_check_model_bh_intra_location_bis.RData") # To save time
3.5.6.5.2 Visualize outputs
Once the computation is finished, you can visualize the results with
p_out_check_model_bh_intra_location = plot(out_check_model_bh_intra_location)## Distribution of sigma_j in the inverse Gamme distribution are done.## The mu_ij posterior distributions are done.## The beta_jk posterior distributions are done.## The sigma_j posterior distributions are done.## The standardised residuals distributions are done.p_out_check_model_bh_intra_location is a list with:
sigma_j_gamma: mean of eachsigma_jdisplayed on the Inverse Gamma distribution. The first graph represents all thesigma_j, the other graph represent the same information divided into several graphs (based on argumentnb_parameters_per_plot).
p_out_check_model_bh_intra_location$sigma_j_gamma[[1]]
p_out_check_model_bh_intra_location$sigma_j_gamma[[2]]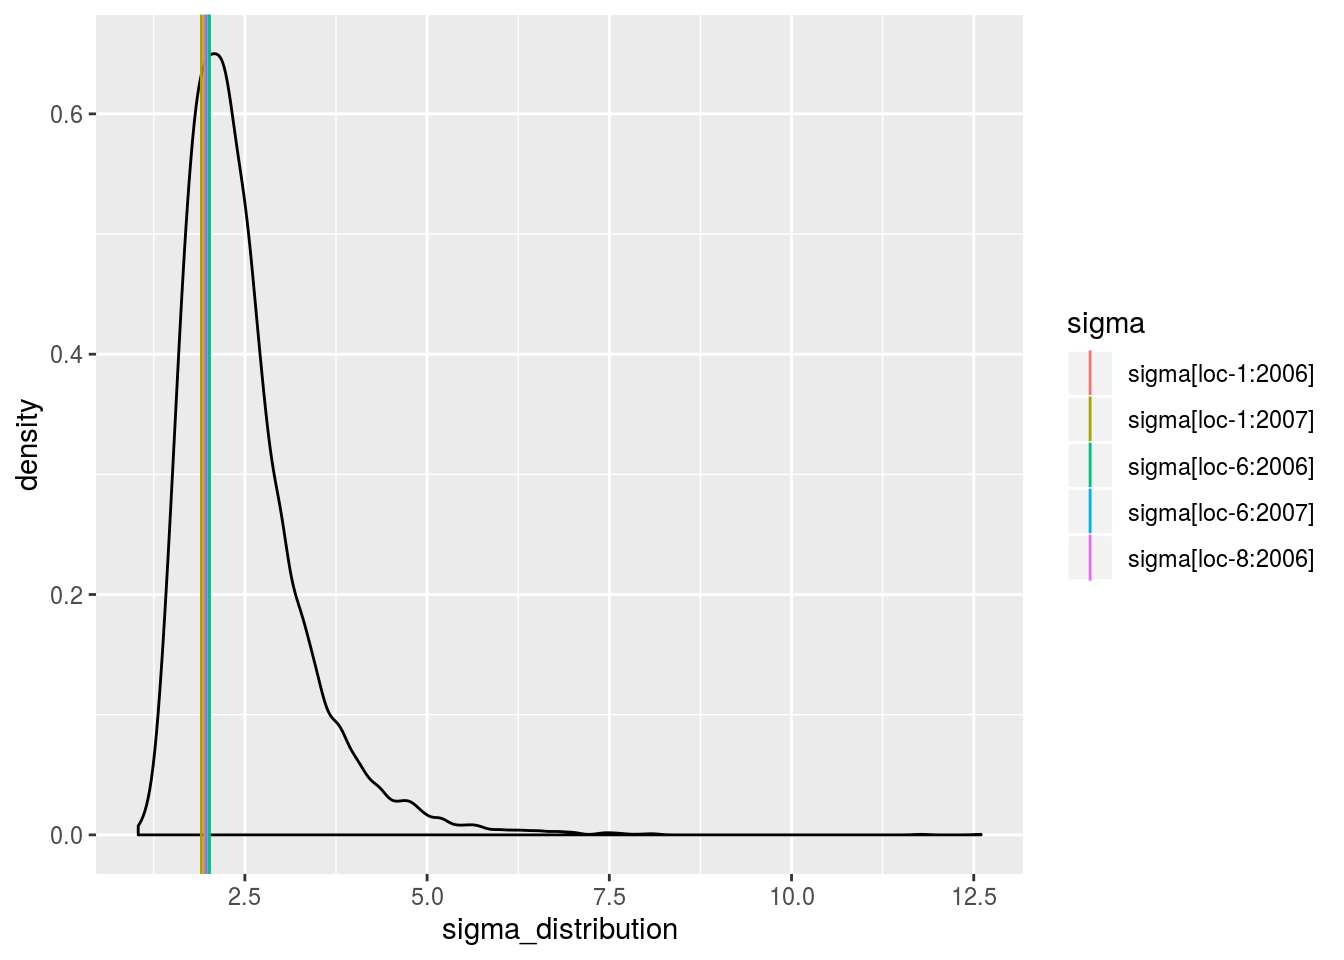
mu_ij: distribution of eachmu_ijin a list with as many elements as environment. For each element of the list, there are as many graph as needed withnb_parameters_per_plotmu_ijper graph.
names(p_out_check_model_bh_intra_location$mu_ij)## [1] "loc-10:2005" "loc-10:2006" "loc-10:2007" "loc-11:2005" "loc-11:2006"
## [6] "loc-11:2007" "loc-1:2005" "loc-1:2006" "loc-1:2007" "loc-12:2005"
## [11] "loc-12:2006" "loc-12:2007" "loc-13:2005" "loc-13:2006" "loc-13:2007"
## [16] "loc-14:2005" "loc-14:2006" "loc-14:2007" "loc-15:2005" "loc-15:2006"
## [21] "loc-15:2007" "loc-16:2005" "loc-16:2006" "loc-16:2007" "loc-17:2005"
## [26] "loc-17:2006" "loc-17:2007" "loc-18:2005" "loc-18:2006" "loc-18:2007"
## [31] "loc-19:2006" "loc-19:2007" "loc-20:2006" "loc-20:2007" "loc-21:2006"
## [36] "loc-21:2007" "loc-2:2005" "loc-2:2006" "loc-2:2007" "loc-22:2006"
## [41] "loc-22:2007" "loc-23:2006" "loc-23:2007" "loc-3:2005" "loc-3:2006"
## [46] "loc-3:2007" "loc-4:2005" "loc-4:2006" "loc-4:2007" "loc-5:2006"
## [51] "loc-6:2006" "loc-6:2007" "loc-7:2006" "loc-7:2007" "loc-8:2006"
## [56] "loc-9:2005" "loc-9:2006" "loc-9:2007"names(p_out_check_model_bh_intra_location$mu_ij$`loc-10:2005`)## [1] "1"p_out_check_model_bh_intra_location$mu_ij$`loc-10:2005`$`1`
beta_jk: distribution of eachbeta_jkin a list with as many elements as environment. For each element of the list, there are as many graph as needed withnb_parameters_per_plotbeta_jkper graph.
names(p_out_check_model_bh_intra_location$beta_jk)## [1] "loc-1:2005" "loc-1:2006" "loc-1:2007" "loc-2:2005" "loc-2:2006"
## [6] "loc-2:2007" "loc-3:2005" "loc-3:2006" "loc-3:2007" "loc-4:2005"
## [11] "loc-4:2006" "loc-4:2007" "loc-5:2006" "loc-6:2006" "loc-6:2007"
## [16] "loc-7:2006" "loc-7:2007" "loc-8:2006"names(p_out_check_model_bh_intra_location$beta_jk$`loc-1:2005`)## [1] "1"p_out_check_model_bh_intra_location$beta_jk$`loc-1:2005`$`1`
sigma_j: distribution of eachsigma_j. There are as many graph as needed withnb_parameters_per_plotsigma_jper graph.
names(p_out_check_model_bh_intra_location$sigma_j)## [1] "1" "2" "3" "4" "5" "6" "7" "8"p_out_check_model_bh_intra_location$sigma_j[[1]]
epsilon_ijk: standardised residuals distribution. If the model went well it should be between -2 and 2.
p_out_check_model_bh_intra_location$epsilon_ijk
mcmc_not_converge_traceplot_density: a list with the plots of trace and density to check the convergence of the two MCMC only for chains that are not converging detected by the Gelman-Rubin test. If all the chains converge, it is NULL
p_out_check_model_bh_intra_location$mcmc_not_converge_traceplot_density## NULLHere all the parameters converged.
When considering p_out_check_model_bh_intra_location_bis, there is no convergence because the MCMC are too small.
p_out_check_model_bh_intra_location_bis = plot(out_check_model_bh_intra_location_bis)## Distribution of sigma_j in the inverse Gamme distribution are done.## The mu_ij posterior distributions are done.## The beta_jk posterior distributions are done.## The sigma_j posterior distributions are done.## Trace and density plot for MCMC that did not converged are done.p_out_check_model_bh_intra_location_bis$mcmc_not_converge_traceplot_density$`sigma\\[loc-15:2006`## $traceplot
##
## $density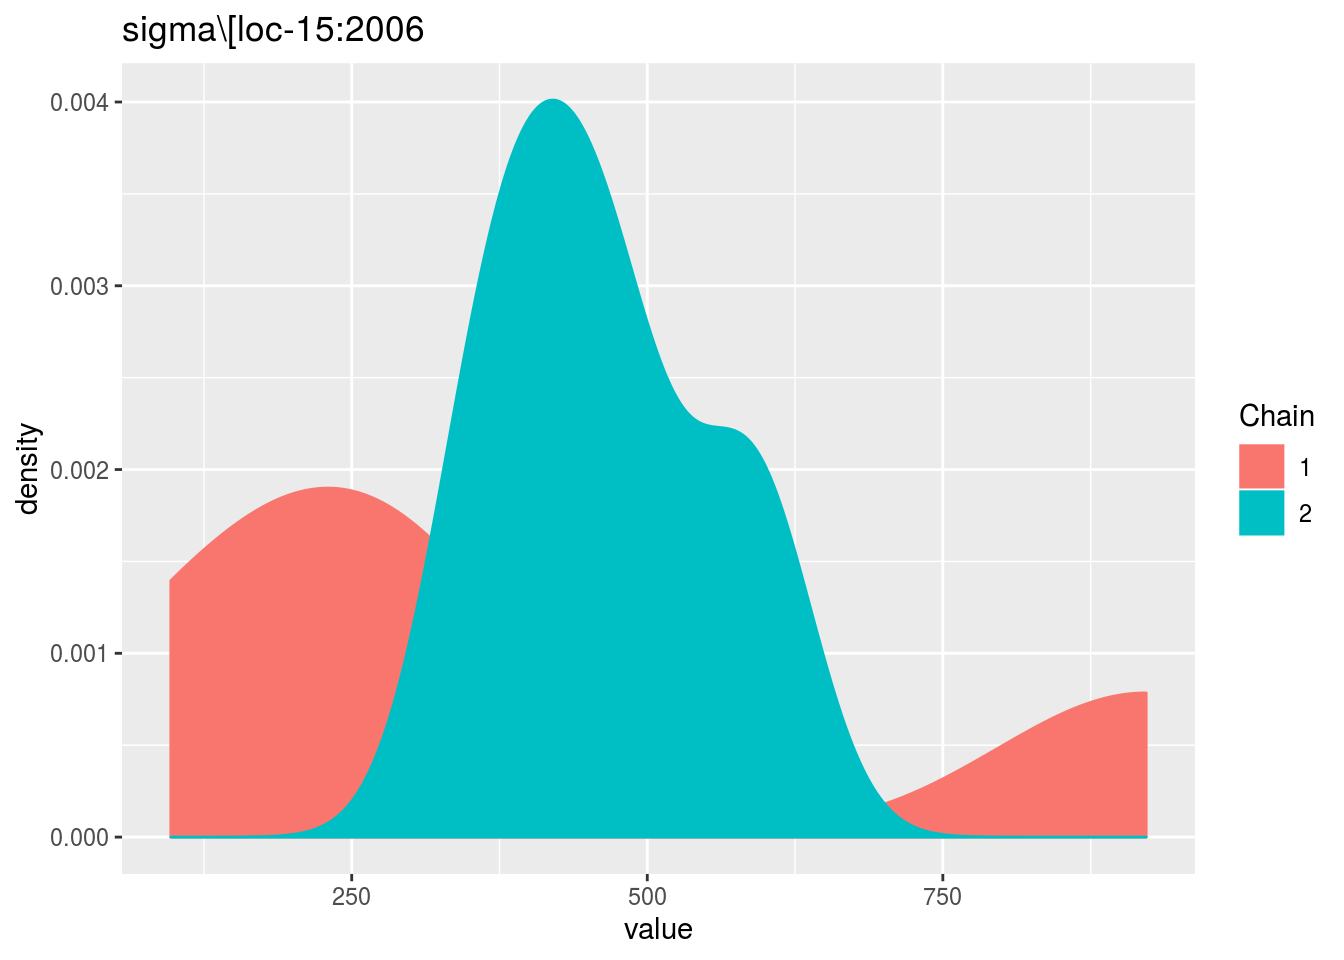
Just for fun, you can compare the posterior medians and the arithmetic means for the mu_ij.
MCMC = out_check_model_bh_intra_location$MCMC
effects = apply(MCMC, 2, median)
mu_ij_estimated = effects[grep("mu",names(effects))]
names(mu_ij_estimated) = sapply(names(mu_ij_estimated),
                                function(x){  sub("\\]", "", sub("mu\\[", "", x)) }
                                )

d = dplyr::filter(data_model_bh_intra_location, location != "loc-24")
d = dplyr::filter(d, location != "loc-25")
d = droplevels(d)
environment = paste(as.character(d$location), as.character(d$year), sep = ":")
d$entry = as.factor(paste(as.character(d$germplasm), environment, sep = ","))
mu_ij = tapply(d$mu_ij, d$entry, mean, na.rm = TRUE)

check_data = cbind.data.frame(mu_ij, mu_ij_estimated[names(mu_ij)])
Let’s have a look on the relation between the posterior medians and the arithmetic means. It goes pretty well!
p = ggplot(check_data, aes(x = mu_ij, y = mu_ij_estimated))
p + stat_smooth(method = "lm") + geom_point()
3.5.6.6 Get and visualize mean comparisons
The method to compute mean comparison are explained in section ??.
3.5.6.6.1 Get mean comparisons
Get mean comparisons with mean_comparisons.
The theory behind mean comparisons has been explained in section ??.
Below is an example for \(\mu\), the same can be done for \(\beta\).
# out_mean_comparisons_model_bh_intra_location_mu = mean_comparisons(out_check_model_bh_intra_location, parameter = "mu")

# Get at least X groups for loc-11:2007. It may take some time ...
# Get at least X groups for loc-11:2007 is done.
# Get at least X groups for loc-17:2005. It may take some time ...
# Get at least X groups for loc-17:2005 is done.
# Get at least X groups for loc-21:2006. It may take some time ...
# Get at least X groups for loc-21:2006 is done.
# Get at least X groups for loc-9:2006. It may take some time ...
# Get at least X groups for loc-9:2006 is done.

load("./data_PPBstats/out_mean_comparisons_model_bh_intra_location_mu.RData") # To save time
out_mean_comparisons_model_bh_intra_location_mu is a list of three elements:
data_mean_comparisonsa list with as many elements as environment.
head(names(out_mean_comparisons_model_bh_intra_location_mu$data_mean_comparisons))## [1] "loc-1:2005" "loc-1:2006" "loc-1:2007" "loc-2:2005" "loc-2:2006"
## [6] "loc-2:2007"Each element of the list is composed of two elements:
- `mean.comparisons`

```r
head(out_mean_comparisons_model_bh_intra_location_mu$data_mean_comparisons$`loc-1:2005`$mean.comparisons)
```

```
##                parameter   median groups nb_group alpha alpha.correction
## 1  mu[germ-3,loc-1:2005] 38.42457      a       10  0.05        soft.bonf
## 2  mu[germ-1,loc-1:2005] 41.73724     ab       10  0.05        soft.bonf
## 3 mu[germ-10,loc-1:2005] 45.91424    abc       10  0.05        soft.bonf
## 4 mu[germ-18,loc-1:2005] 47.76006   abcd       10  0.05        soft.bonf
## 5  mu[germ-2,loc-1:2005] 48.10288  abcde       10  0.05        soft.bonf
## 6 mu[germ-19,loc-1:2005] 49.20361 abcdef       10  0.05        soft.bonf
##     entry environment location year
## 1  germ-3  loc-1:2005    loc-1 2005
## 2  germ-1  loc-1:2005    loc-1 2005
## 3 germ-10  loc-1:2005    loc-1 2005
## 4 germ-18  loc-1:2005    loc-1 2005
## 5  germ-2  loc-1:2005    loc-1 2005
## 6 germ-19  loc-1:2005    loc-1 2005
```

- `Mpvalue` : a square matrix with pvalue computed for each pair of parameter.

```r
out_mean_comparisons_model_bh_intra_location_mu$data_mean_comparisons$`loc-1:2005`$Mpvalue[1:3, 1:3]
```

```
##                        mu[germ-3,loc-1:2005] mu[germ-1,loc-1:2005]
## mu[germ-3,loc-1:2005]                      0               0.17505
## mu[germ-1,loc-1:2005]                      0               0.00000
## mu[germ-10,loc-1:2005]                     0               0.00000
##                        mu[germ-10,loc-1:2005]
## mu[germ-3,loc-1:2005]                 0.03940
## mu[germ-1,loc-1:2005]                 0.15185
## mu[germ-10,loc-1:2005]                0.00000
```data_env_with_no_controlsa list with as many elements as environment.
names(out_mean_comparisons_model_bh_intra_location_mu$data_env_with_no_controls)## [1] "loc-25:2005"Each list contains mean.comparisons. Note there are no groups displayed. Inded, there were no controls on the environment so no model was run.
head(out_mean_comparisons_model_bh_intra_location_mu$data_env_with_no_controls$`loc-25:2005`$mean.comparisons)## entry germplasm environment block X Y median
## 1 germ-12,loc-25:2005 germ-12 loc-25:2005 1 4 d 38.02544
## 2 germ-18,loc-25:2005 germ-18 loc-25:2005 1 5 e 44.49495
## 3 germ-19,loc-25:2005 germ-19 loc-25:2005 1 6 f 44.46948
## 4 germ-1,loc-25:2005 germ-1 loc-25:2005 1 3 c 42.32750
## 5 germ-20,loc-25:2005 germ-20 loc-25:2005 1 7 g 35.77590
## 6 germ-21,loc-25:2005 germ-21 loc-25:2005 1 8 h 36.59313
## parameter location year
## 1 mu[germ-12,loc-25:2005] loc-25 2005
## 2 mu[germ-18,loc-25:2005] loc-25 2005
## 3 mu[germ-19,loc-25:2005] loc-25 2005
## 4 mu[germ-1,loc-25:2005] loc-25 2005
## 5 mu[germ-20,loc-25:2005] loc-25 2005
## 6 mu[germ-21,loc-25:2005] loc-25 2005data_env_whose_param_did_not_convergea list with as many elements as environment.
names(out_mean_comparisons_model_bh_intra_location_mu$data_env_whose_param_did_not_converge)## NULLHere it is NULL as all parameters converge. Otherwise in each list it is mean.comparisons. Note there are no groups displayed. Inded, the model did not well so no mean comparisons were done.
head(out_mean_comparisons_model_bh_intra_location_mu$data_env_with_no_controls$`loc-5:2005`$mean.comparisons)## NULL3.5.6.6.2 Visualize mean comparisons
To see the output, use plot.
On each plot, the alpha (type one error) value and the alpha correction are displayed.
alpha = Imp means that no differences could be detected.
For plot_type = "interaction" and plot_type = "score", it is displayed under the form: alpha | alpha correction.
The ggplot are done for each element of the list coming from mean_comparisons.
For each plot_type, it is a list of three lists each with as many elements as environments.
For each element of the list, there are as many graphs as needed with nb_parameters_per_plot parameters per graph.
3.5.6.6.2.1 barplot
p_barplot_mu = plot(out_mean_comparisons_model_bh_intra_location_mu, plot_type = "barplot")
names(p_barplot_mu)
## [1] "data_mean_comparisons"
## [2] "data_env_with_no_controls"
## [3] "data_env_whose_param_did_not_converge"From data_mean_comparisons, only environments where all MCMC converged are represented.
Letters are displayed on each bar. Parameters that do not share the same letters are different based on type I error (alpha) and alpha correction.
The error I (alpha) and the alpha correction are displayed in the title. alpha = Imp means that no significant differences coumd be detected.
p = p_barplot_mu$data_mean_comparisons

head(names(p))
## [1] "loc-1:2005" "loc-1:2006" "loc-1:2007" "loc-2:2005" "loc-2:2006"
## [6] "loc-2:2007"p_env = p$`loc-1:2005`
names(p_env)## [1] "1" "2" "3" "4"p_env$`1`
p_env$`2`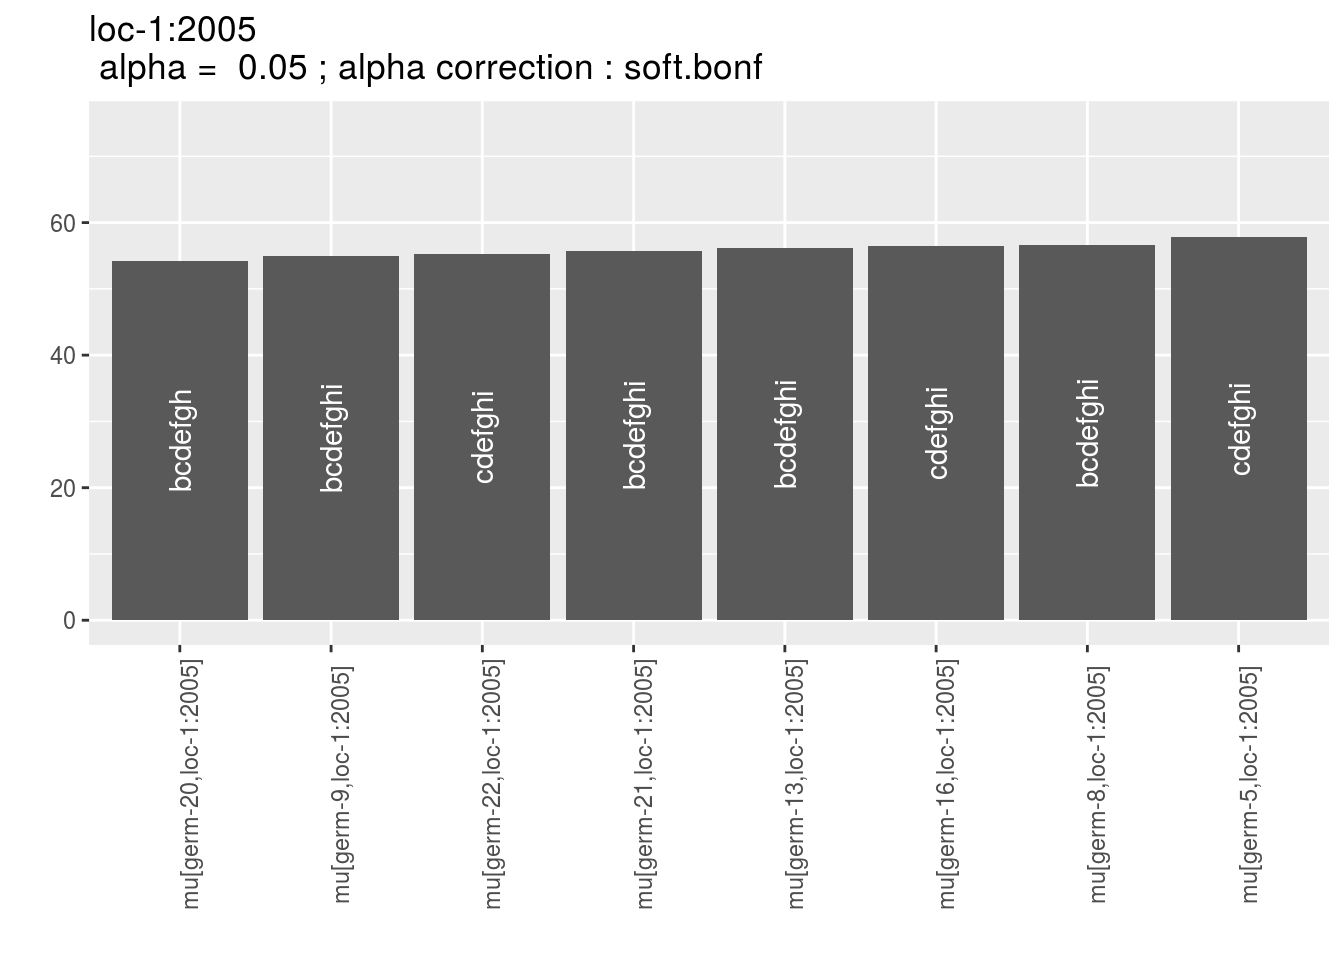
p_env$`3`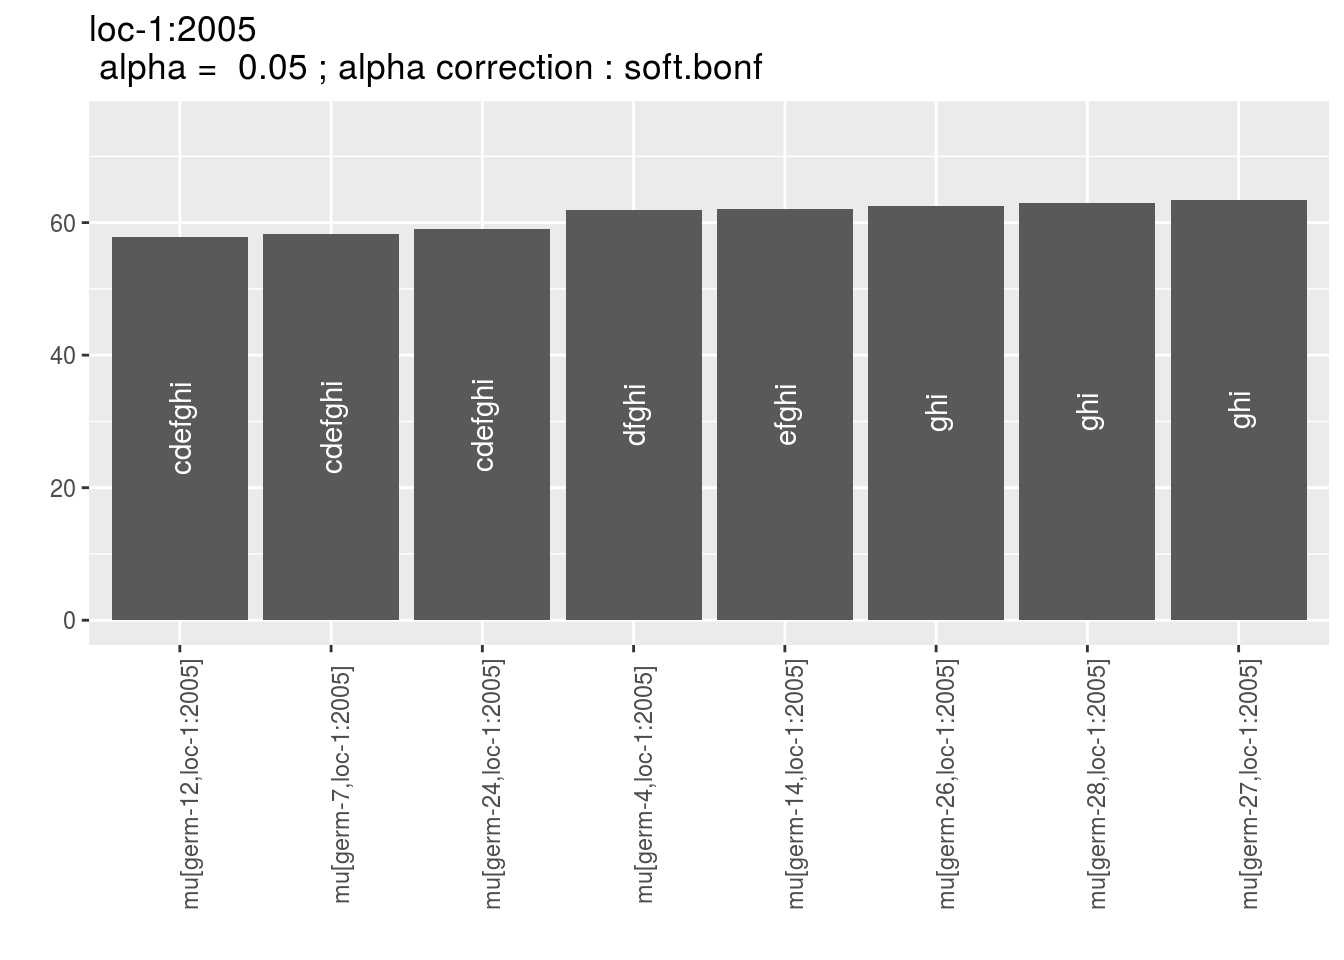
p_env$`4`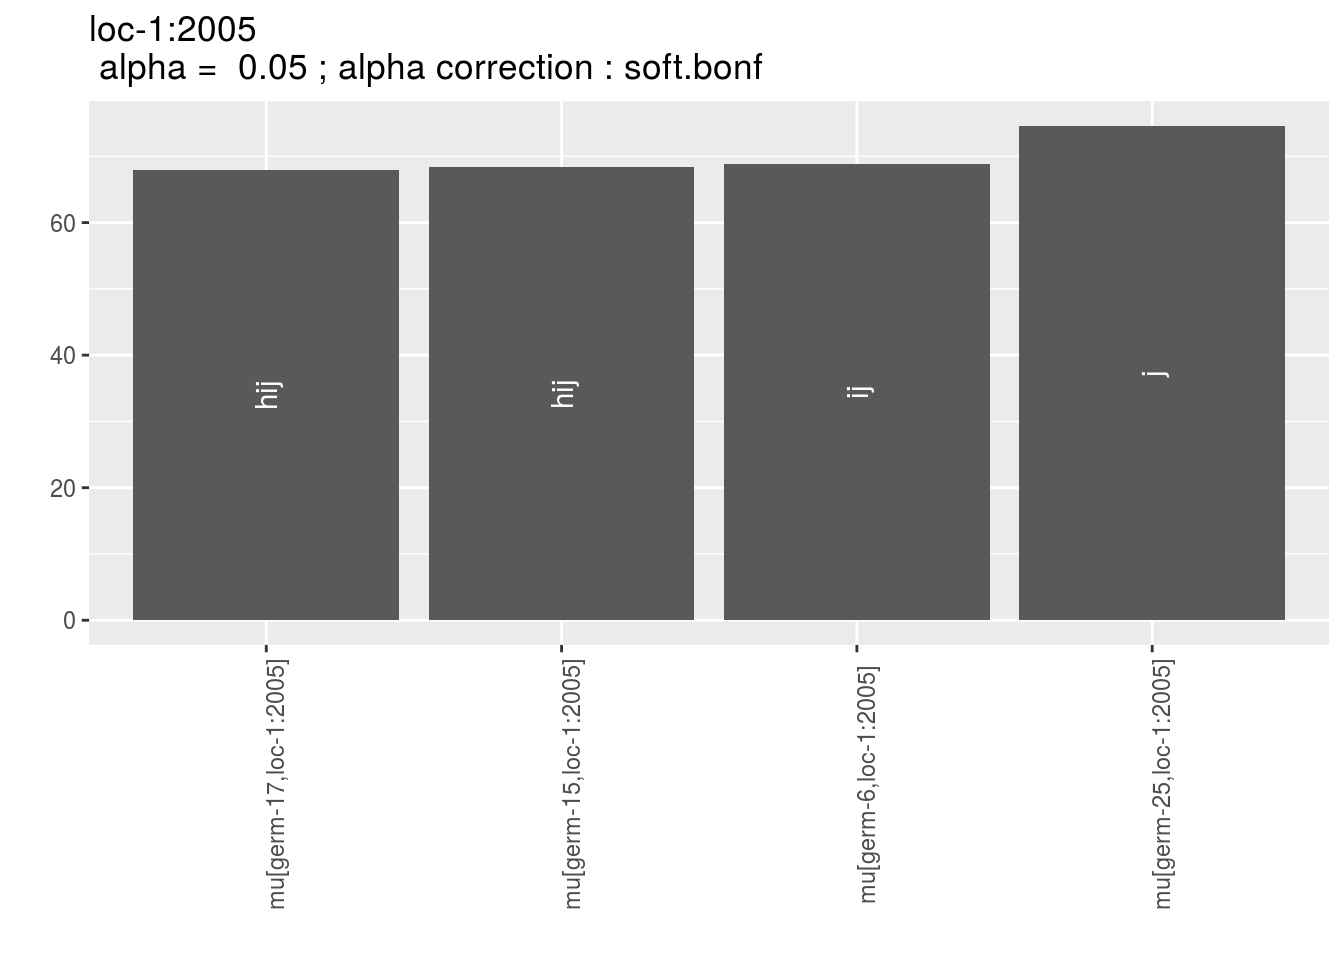
For data_env_with_no_controls, only environments where there were no controls are represented.
p_barplot_mu$data_env_with_no_controls## $`loc-25:2005`
## $`loc-25:2005`$`1`
For data_env_whose_param_did_not_converge, only environments where MCMC did not converge are represented.
p_barplot_mu$data_env_whose_param_did_not_converge## list()3.5.6.6.2.2 interaction
With plot_type = "interaction", you can display the year effect as well as detect groups.
One group is represented by one vertical line.
Germplasms which share the same group are not different.
Germplasms which do not share the same groupe are different (Section ??).
The ggplot are done for each element of the list coming rom mean_comparisons.
For each plot_type, it is a list of three elements being lists with as many elements as environment.
For each element of the list, there are as many graph as needed with nb_parameters_per_plot parameters per graph.
p_interaction = plot(out_mean_comparisons_model_bh_intra_location_mu, plot_type = "interaction")

head(names(p_interaction$data_mean_comparisons))
## [1] "loc-1" "loc-10" "loc-11" "loc-12" "loc-13" "loc-14"p_env = p_interaction$data_mean_comparisons$`loc-1`
names(p_env)## [1] "1" "2" "3" "4"p_env$`1`
p_env$`2`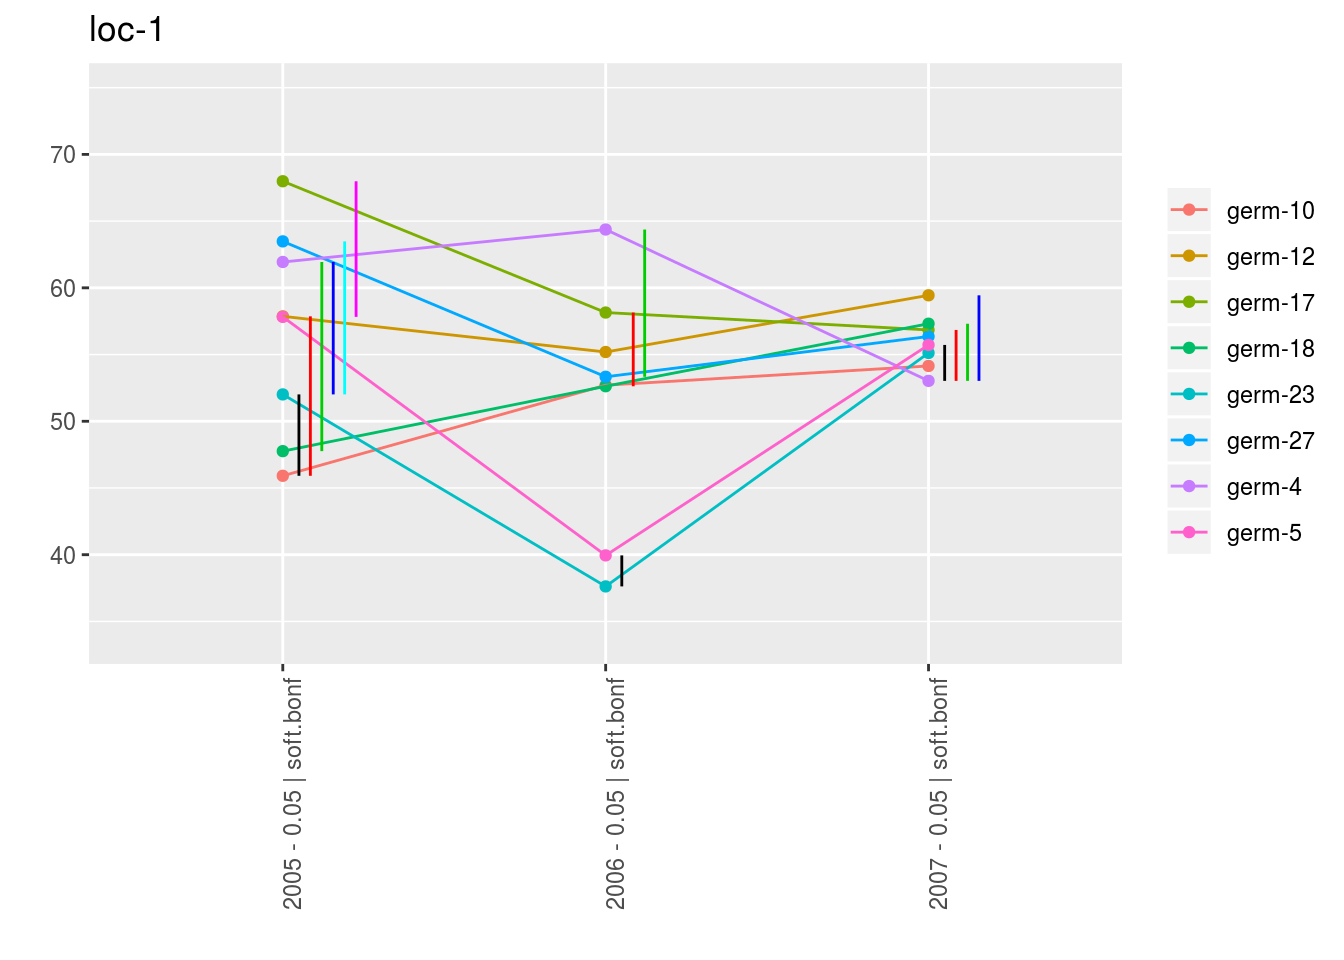
p_env$`3`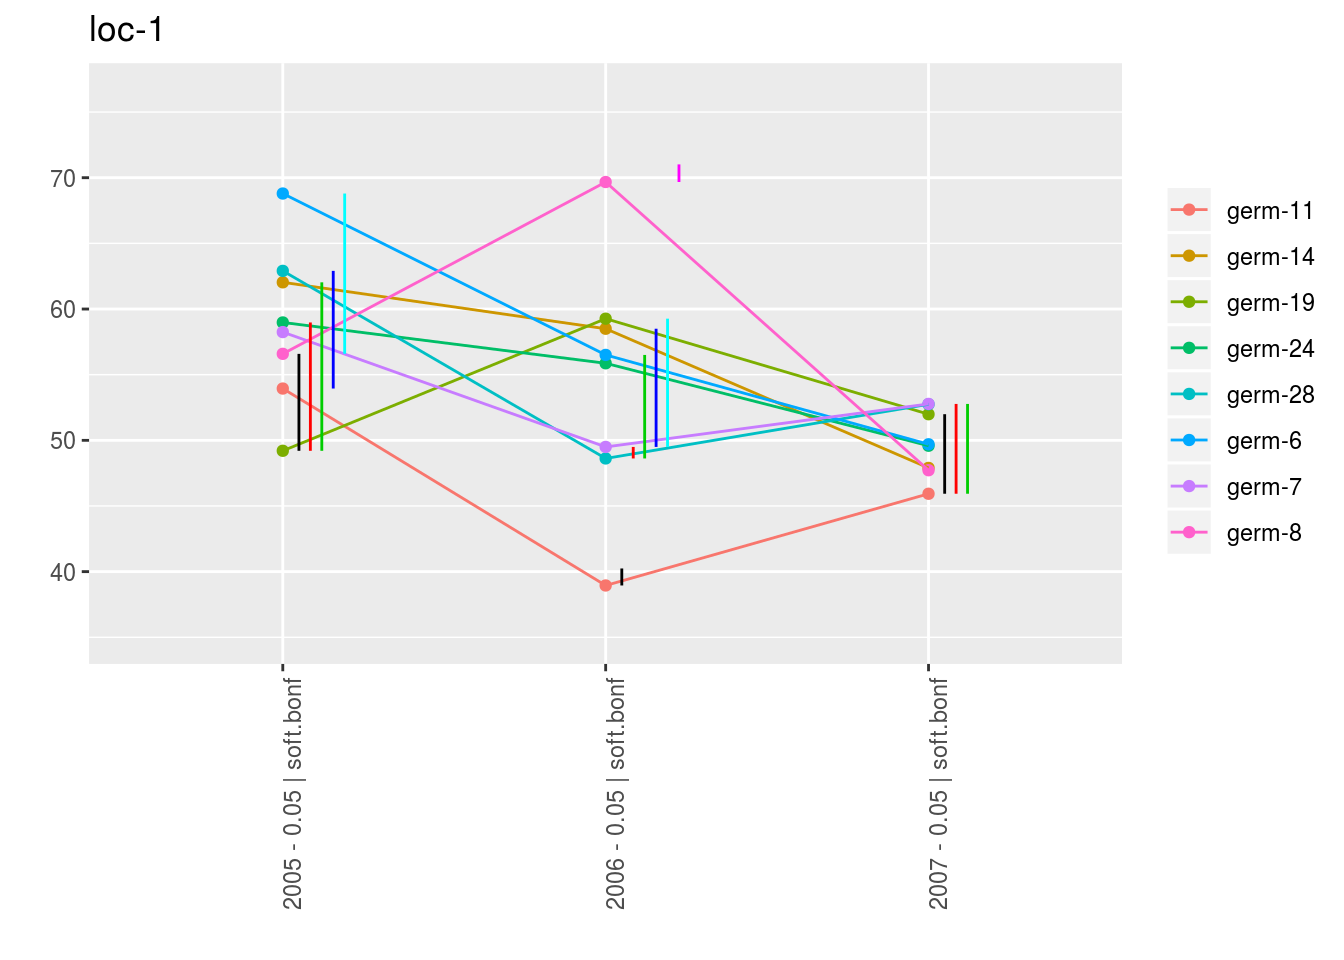
p_env$`4`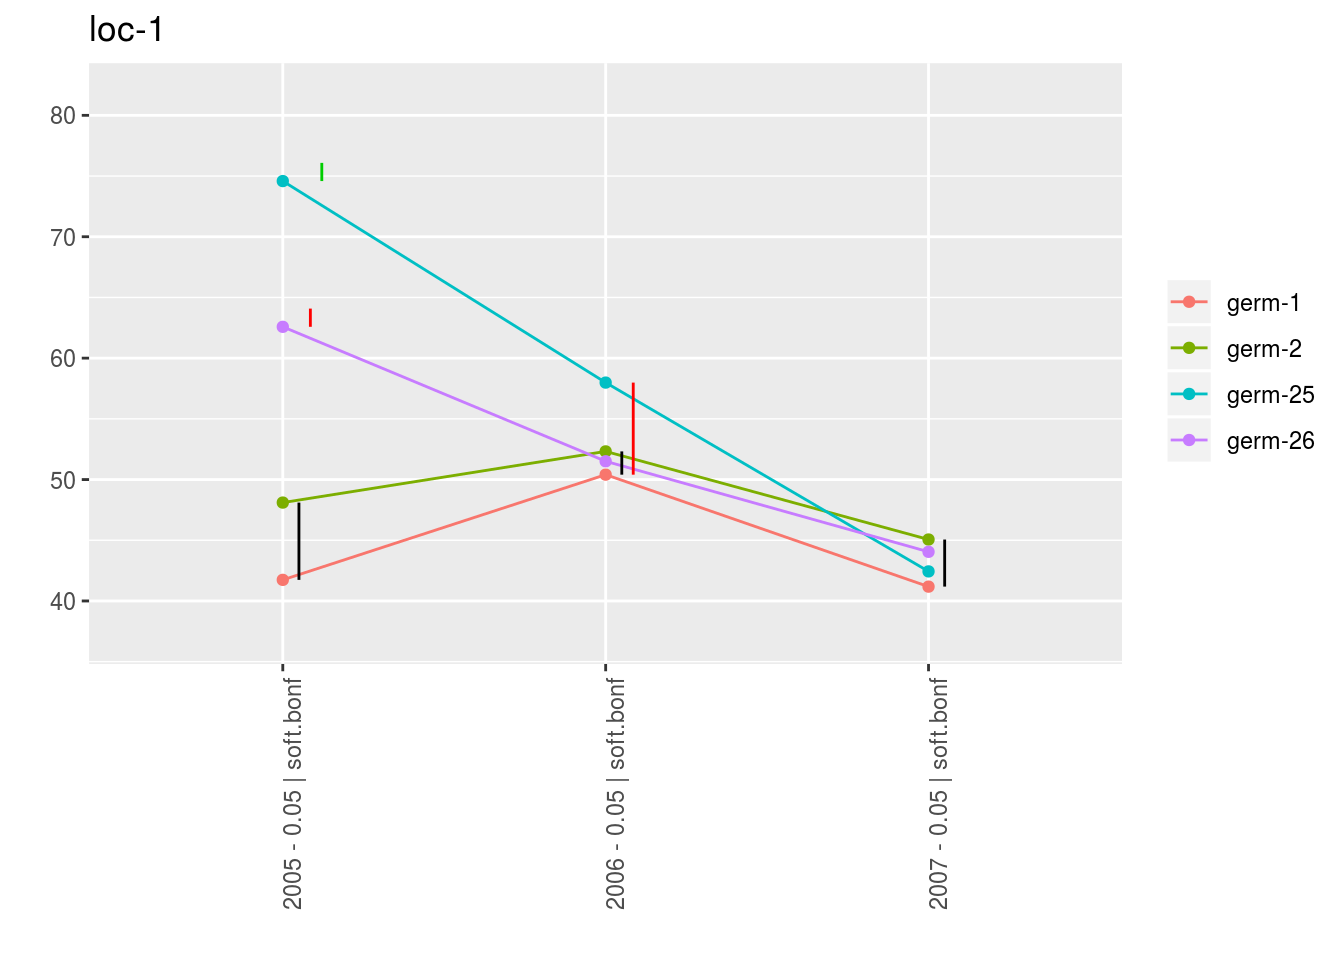
3.5.6.6.3 score
For the score, more entries are displayed. An high score means that the entry was in a group with an high mean. A low socre means that the entry was in a group with an low mean. In the legend, the score goes from 1 (first group) to the number of groups of significativity. This plot is useful to look at year effects.
p_score = plot(out_mean_comparisons_model_bh_intra_location_mu, plot_type = "score")

head(names(p_score))
## [1] "loc-1" "loc-10" "loc-11" "loc-12" "loc-13" "loc-14"p_env = p_score$`loc-1`
names(p_env)## [1] "1" "2" "3" "4"p_env$`1`
p_env$`2`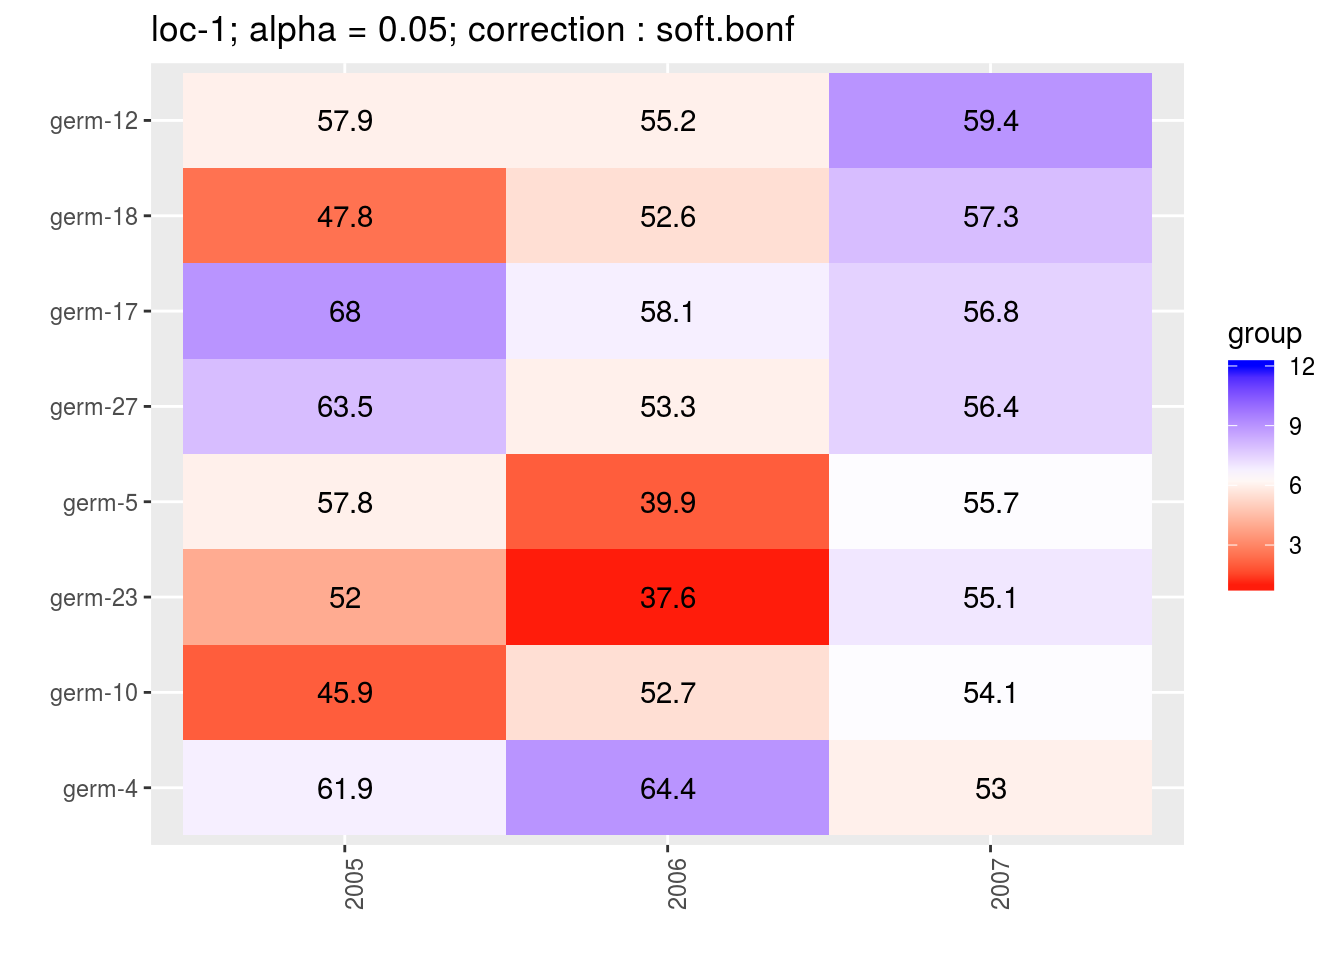
p_env$`3`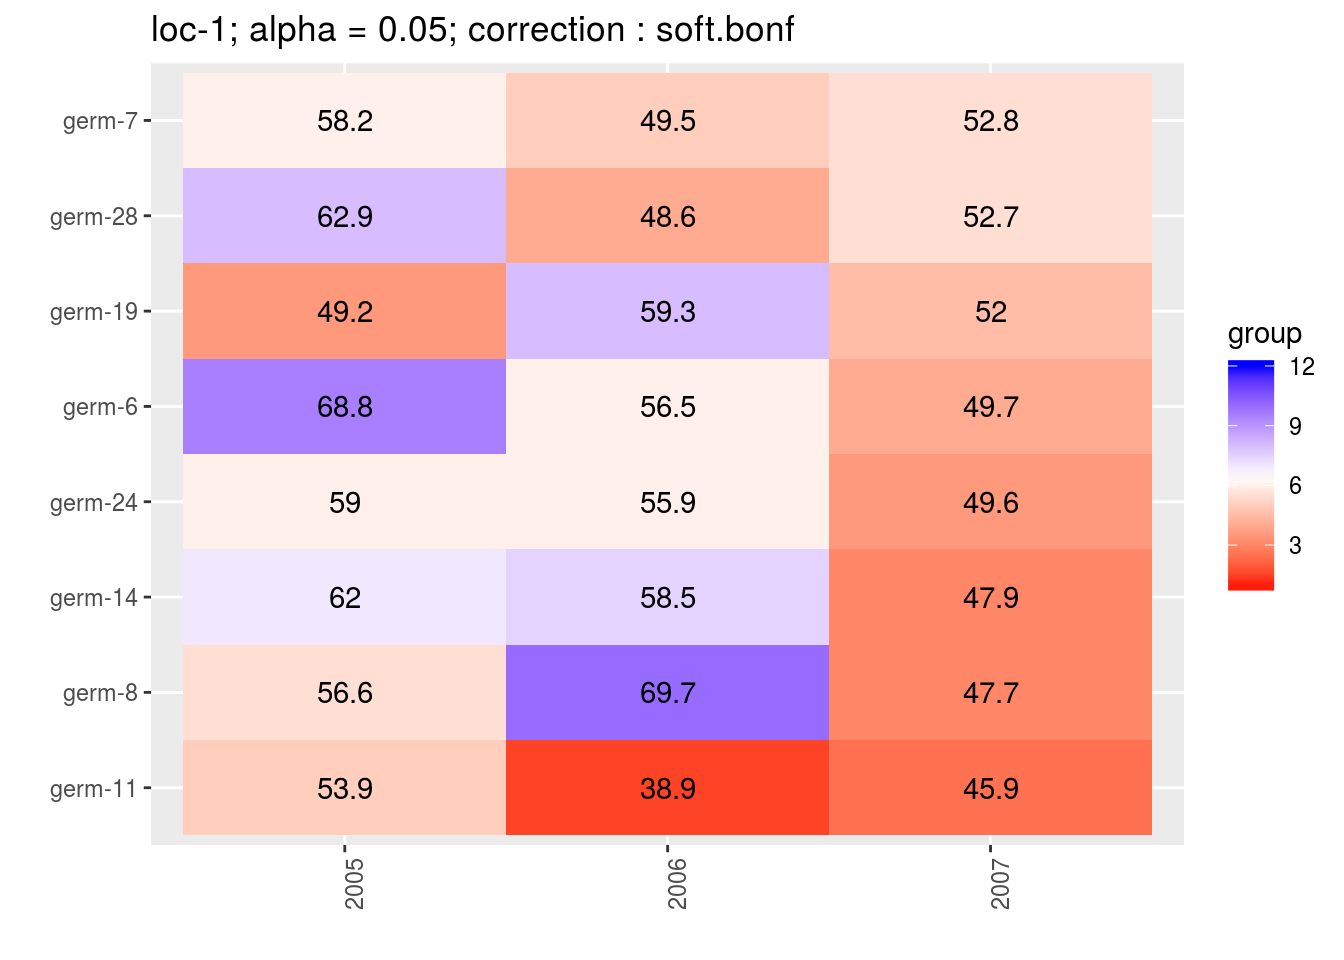
p_env$`4`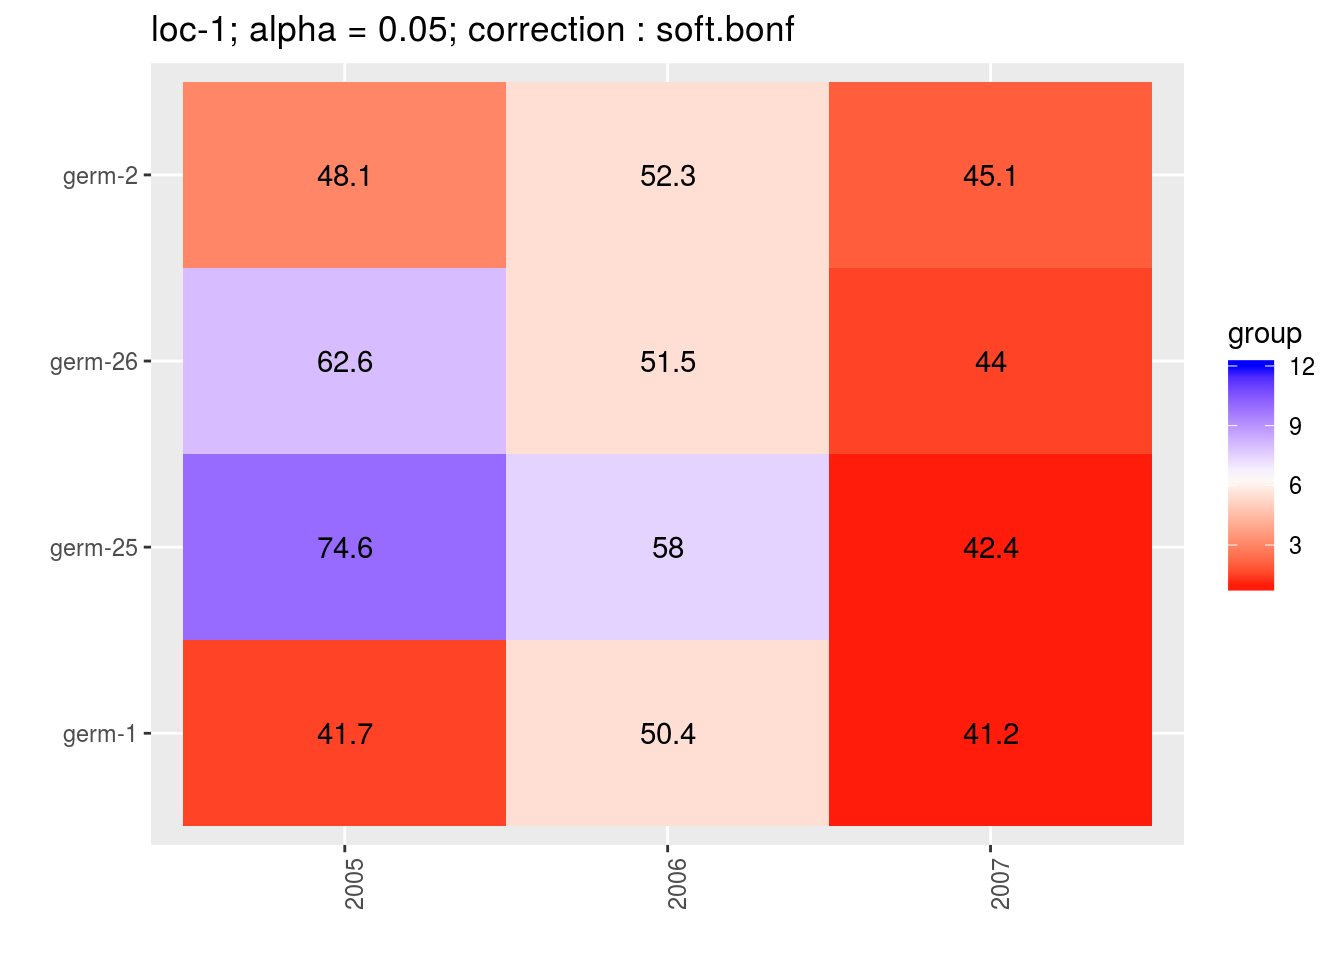
3.5.6.7 Apply the workflow to several variables
If you wish to apply the model_bh_intra_location workflow to several variables, you can use lapply with the following code :
workflow_model_bh_intra_location = function(x){
  out_model_bh_intra_location = model_bh_intra_location(data = data_model_bh_intra_location, variable = x, return.epsilon = TRUE)

  out_check_model_bh_intra_location = check_model(out_model_bh_intra_location)
  p_out_check_model_bh_intra_location = plot(out_check_model_bh_intra_location)

  out_mean_comparisons_model_bh_intra_location_mu = mean_comparisons(out_check_model_bh_intra_location, parameter = "mu")
  p_barplot_mu = plot(out_mean_comparisons_model_bh_intra_location_mu, plot_type = "barplot")
  p_interaction = plot(out_mean_comparisons_model_bh_intra_location_mu, plot_type = "interaction")
  p_score = plot(out_mean_comparisons_model_bh_intra_location_mu, plot_type = "score")

  out = list(
    "out_model_bh_intra_location" = out_model_bh_intra_location,
    "out_check_model_bh_intra_location" = out_check_model_bh_intra_location,
    "p_out_check_model_bh_intra_location" = p_out_check_model_bh_intra_location,
    "out_mean_comparisons_model_bh_intra_location_mu" = out_mean_comparisons_model_bh_intra_location_mu,
    "p_barplot_mu" = p_barplot_mu,
    "p_interaction" = p_interaction,
    "p_score" = p_score
    )
  return(out)
}

## Not run because of memory and time issues !
# vec_variables = c("y1", "y2", "y3")
#
# out = lapply(vec_variables, workflow_model_bh_intra_location)
# names(out) = vec_variables
References
Desclaux, D., J. M. Nolot, Y. Chiffoleau, C. Leclerc, and E. Gozé. 2008. “Changes in the Concept of Genotype X Environment Interactions to Fit Agriculture Diversification and Decentralized Participatory Plant Breeding: Pluridisciplinary Point of View.” Euphytica 163: 533–46.
Plummer, M. 2008. “Penalized Loss Functions for Bayesian Model Comparison.” Biostatistics 9 (3): 523–39.
Rivière, P., J.C. Dawson, I. Goldringer, and O. David. 2015. “Hierarchical Bayesian Modeling for Flexible Experiments in Decentralized Participatory Plant Breeding.” Crop Science 55 (3).
Rodrı'guez-Álvarez, X.M., M. P. Boer, F. A. van Eeuwijk, and P. H. C. Eilers. 2016. “Spatial Models for Field Trials.” ArXiv E-Prints, July.
Spiegelhalter, D. J., N. G. Best, B. P. Carlin, and A. Van Der Linde. 2002. “Bayesian Measures of Model Complexity and Fit.” Journal of the Royal Statistical Society: Series B (Statistical Methodology) 64 (4): 583–639.
Zystro, Jared, Micaela Colley, and Julie Dawson. 2018. “Alternative Experimental Designs for Plant Breeding.” In, 87–117. https://doi.org/10.1002/9781119521358.ch3.